ACTL3143 & ACTL5111 Deep Learning for Actuaries
Lecture Outline
Entity Embedding
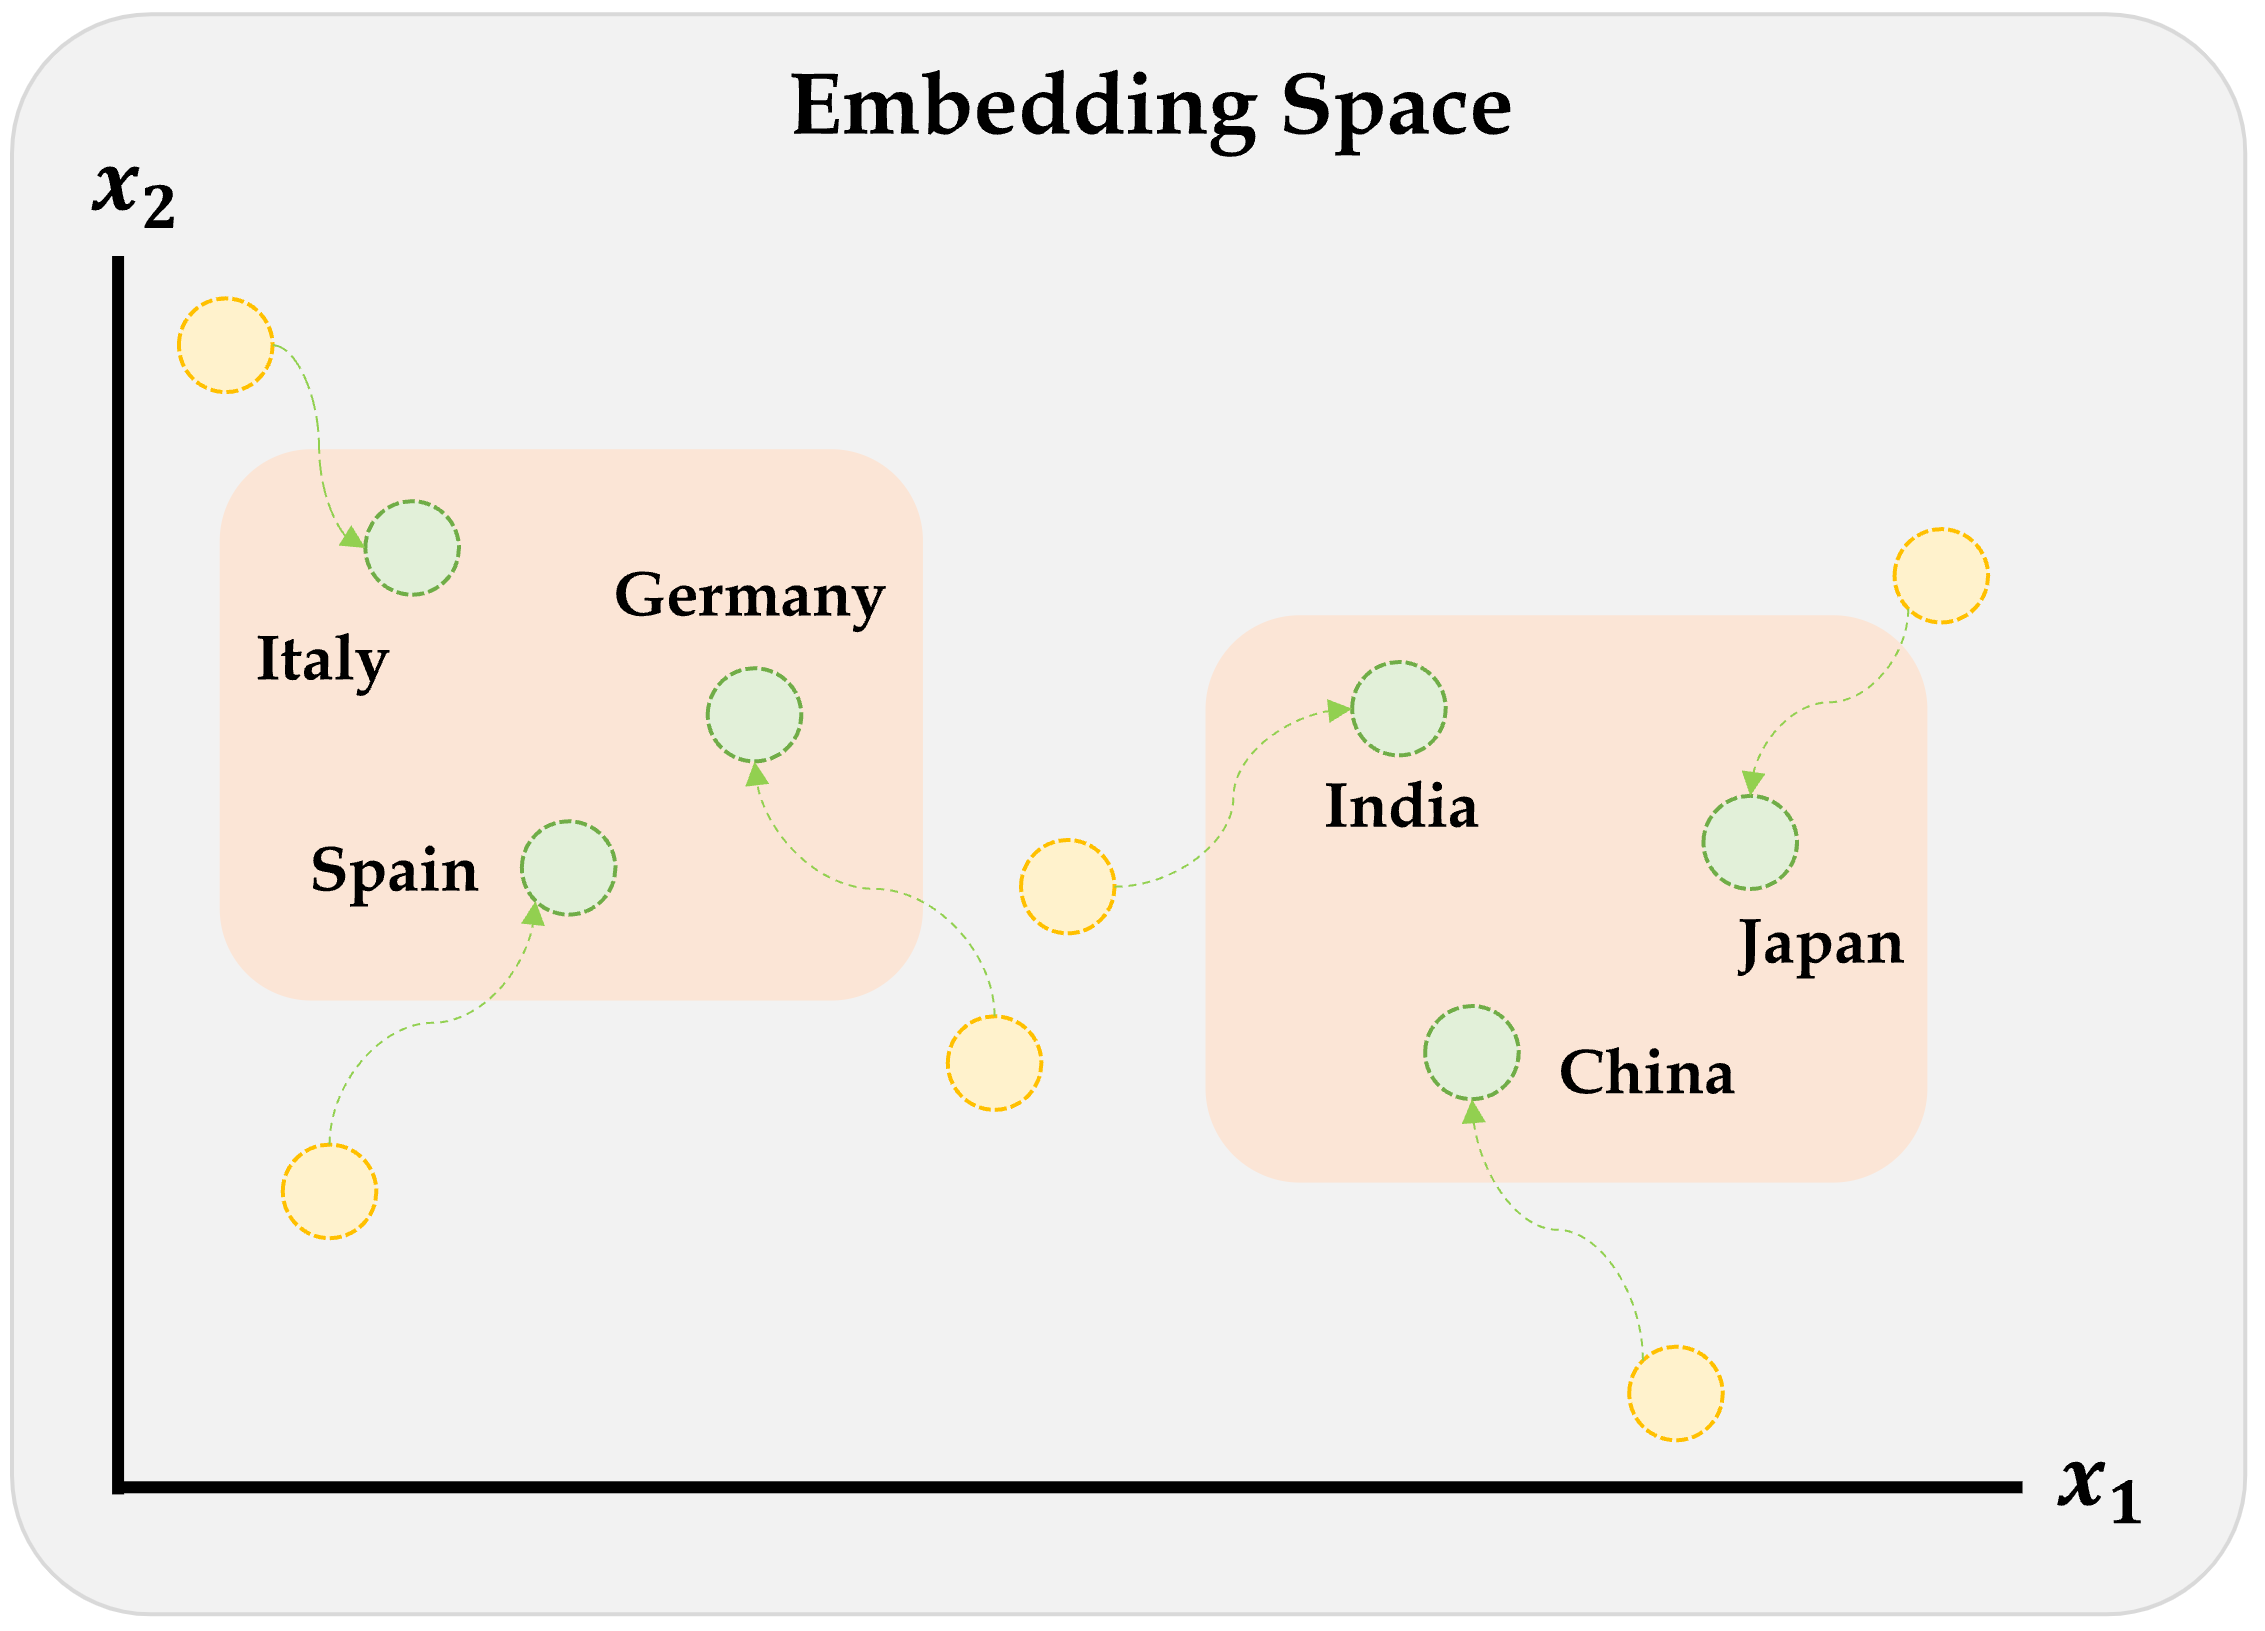
Categorical Variables & Entity Embeddings
Keras’ Functional API
French Motor Dataset with Embeddings
Scale By Exposure
Download the dataset if we don’t have it already.
Source: Nell et al. (2020), Case Study: French Motor Third-Party Liability Claims, SSRN.
IDpol | ClaimNb | Exposure | Area | VehPower | VehAge | DrivAge | BonusMalus | VehBrand | VehGas | Density | Region | |
---|---|---|---|---|---|---|---|---|---|---|---|---|
0 | 1.0 | 1 | 0.10000 | D | 5 | 0 | 55 | 50 | B12 | 'Regular' | 1217 | R82 |
1 | 3.0 | 1 | 0.77000 | D | 5 | 0 | 55 | 50 | B12 | 'Regular' | 1217 | R82 |
... | ... | ... | ... | ... | ... | ... | ... | ... | ... | ... | ... | ... |
678011 | 6114329.0 | 0 | 0.00274 | B | 4 | 0 | 60 | 50 | B12 | 'Regular' | 95 | R26 |
678012 | 6114330.0 | 0 | 0.00274 | B | 7 | 6 | 29 | 54 | B12 | 'Diesel' | 65 | R72 |
678013 rows × 12 columns
IDpol
: policy number (unique identifier)ClaimNb
: number of claims on the given policyExposure
: total exposure in yearly unitsArea
: area code (categorical, ordinal)VehPower
: power of the car (categorical, ordinal)VehAge
: age of the car in yearsDrivAge
: age of the (most common) driver in yearsBonusMalus
: bonus-malus level between 50 and 230 (with reference level 100)VehBrand
: car brand (categorical, nominal)VehGas
: diesel or regular fuel car (binary)Density
: density of inhabitants per km2 in the city of the living place of the driverRegion
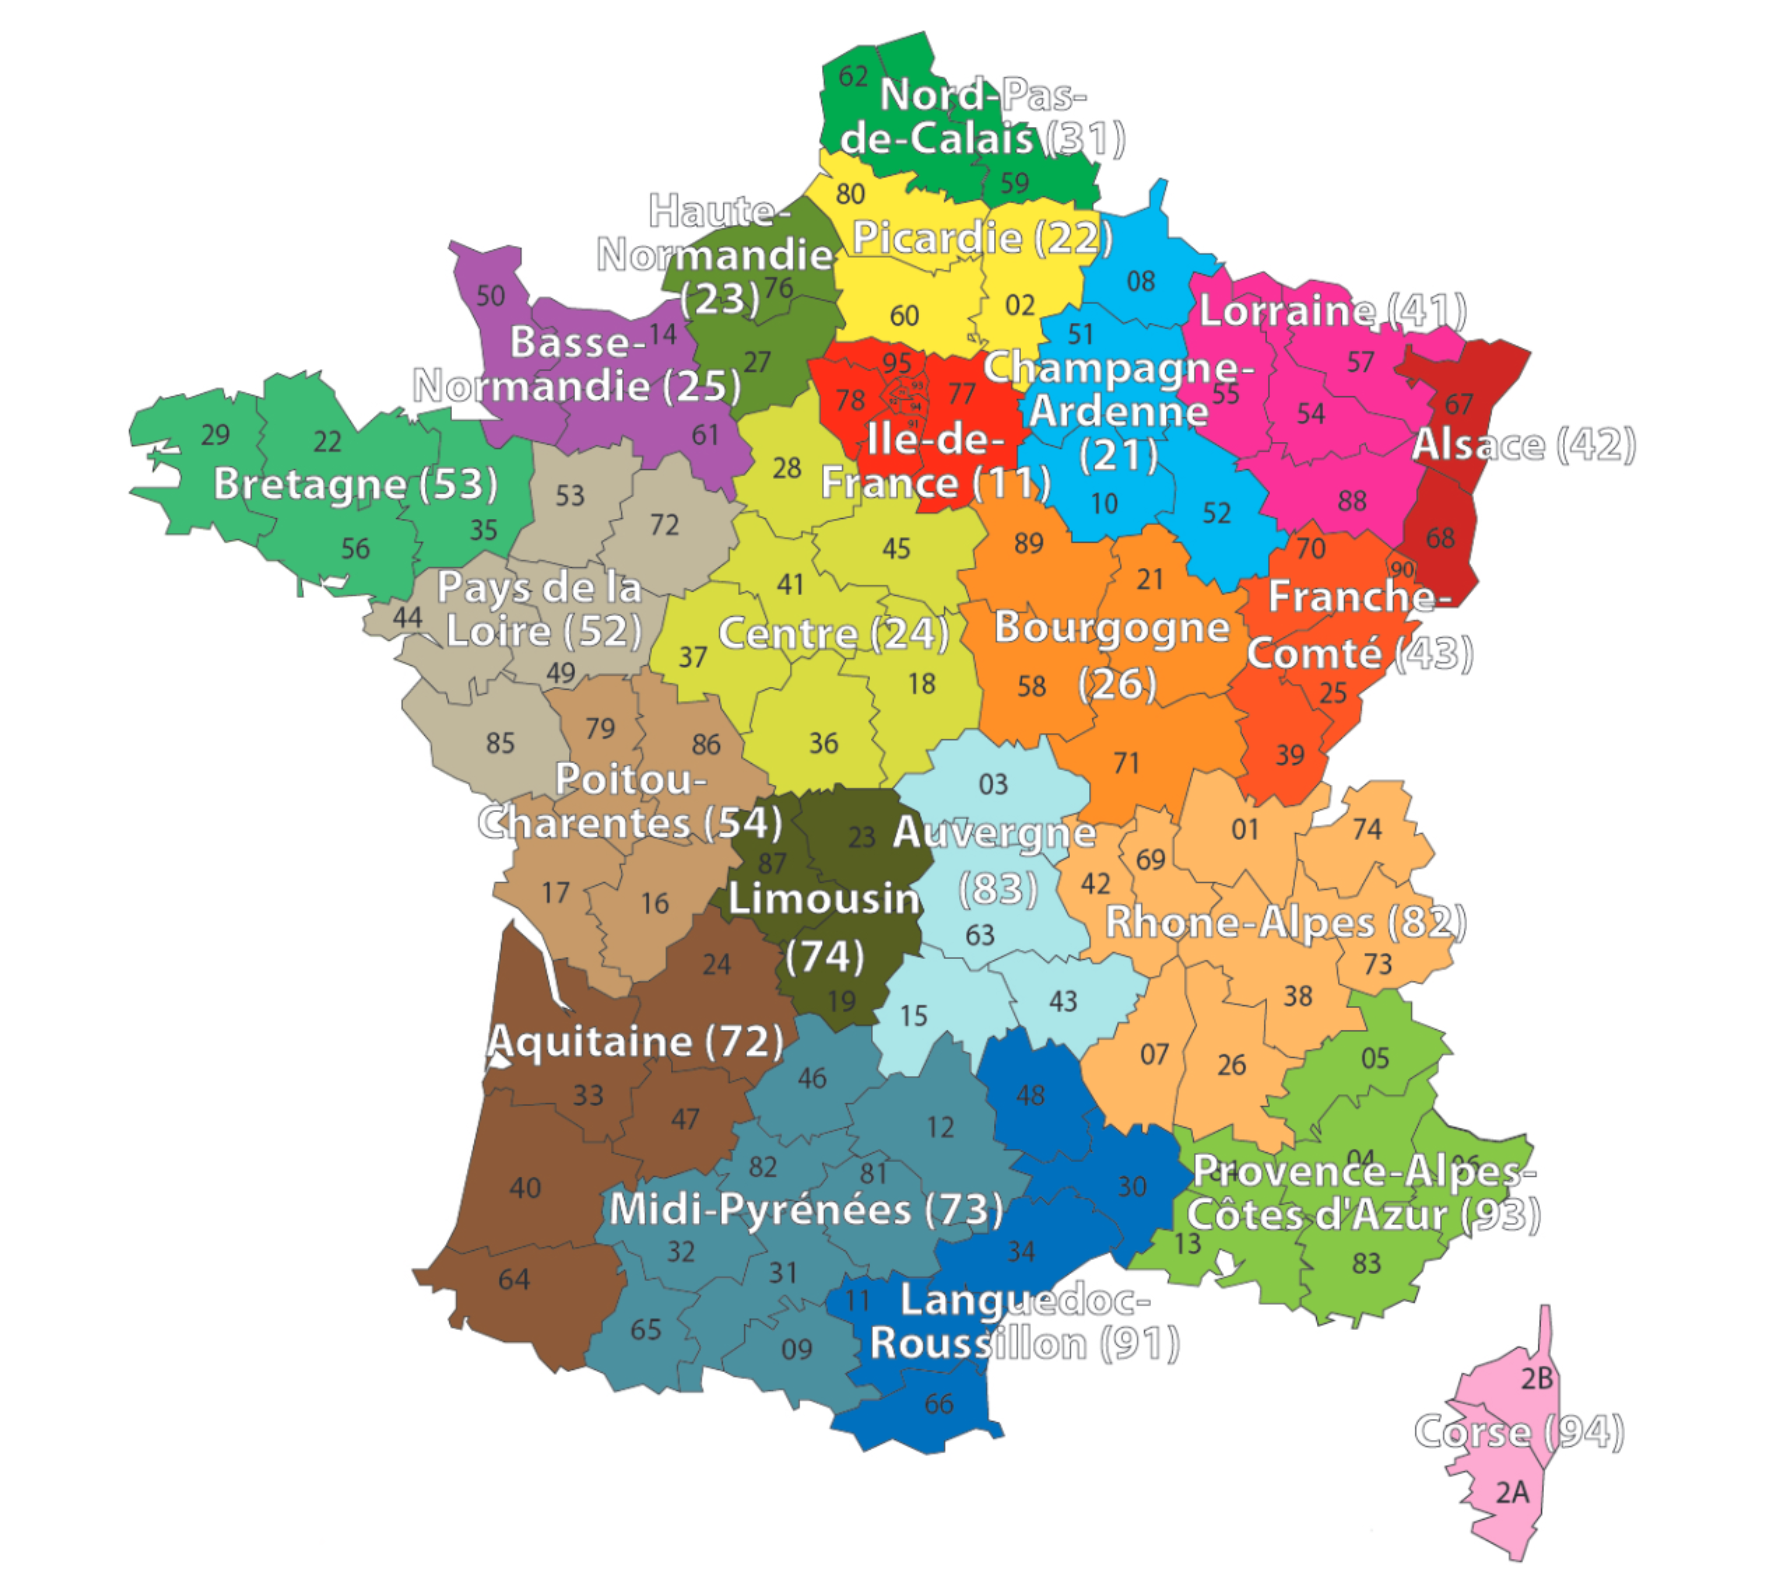
: regions in France (prior to 2016)Source: Nell et al. (2020), Case Study: French Motor Third-Party Liability Claims, SSRN.
Have \{ (\mathbf{x}_i, y_i) \}_{i=1, \dots, n} for \mathbf{x}_i \in \mathbb{R}^{47} and y_i \in \mathbb{N}_0.
Assume the distribution Y_i \sim \mathsf{Poisson}(\lambda(\mathbf{x}_i))
We have \mathbb{E} Y_i = \lambda(\mathbf{x}_i). The NN takes \mathbf{x}_i & predicts \mathbb{E} Y_i.
Note
For insurance, this is a bit weird. The exposures are different for each policy.
\lambda(\mathbf{x}_i) is the expected number of claims for the duration of policy i’s contract.
Normally, \text{Exposure}_i \not\in \mathbf{x}_i, and \lambda(\mathbf{x}_i) is the expected rate per year, then Y_i \sim \mathsf{Poisson}(\text{Exposure}_i \times \lambda(\mathbf{x}_i)).
In Keras, string options are used for convenience to reference specific functions or settings.
is the same as
.compile
When we run
it is equivalent to
Why do this manually? To adjust the object:
or to get help.
Help on function poisson in module keras.src.losses.losses:
poisson(y_true, y_pred)
Computes the Poisson loss between y_true and y_pred.
Formula:
```python
loss = y_pred - y_true * log(y_pred)
```
Args:
y_true: Ground truth values. shape = `[batch_size, d0, .. dN]`.
y_pred: The predicted values. shape = `[batch_size, d0, .. dN]`.
Returns:
Poisson loss values with shape = `[batch_size, d0, .. dN-1]`.
Example:
>>> y_true = np.random.randint(0, 2, size=(2, 3))
>>> y_pred = np.random.random(size=(2, 3))
>>> loss = keras.losses.poisson(y_true, y_pred)
>>> assert loss.shape == (2,)
>>> y_pred = y_pred + 1e-7
>>> assert np.allclose(
... loss, np.mean(y_pred - y_true * np.log(y_pred), axis=-1),
... atol=1e-5)
X_train["Area"].value_counts()
X_train["VehBrand"].value_counts()
X_train["VehGas"].value_counts()
X_train["Region"].value_counts()
Area
C 5507
D 4113
...
B 2359
F 475
Name: count, Length: 6, dtype: int64
VehBrand
B1 5069
B2 4838
...
B11 284
B14 136
Name: count, Length: 11, dtype: int64
VehGas
'Regular' 10773
'Diesel' 7977
Name: count, dtype: int64
Region
R24 6498
R82 2119
...
R42 55
R43 26
Name: count, Length: 22, dtype: int64
Lecture Outline
Entity Embedding
Categorical Variables & Entity Embeddings
Keras’ Functional API
French Motor Dataset with Embeddings
Scale By Exposure
Source: Nell et al. (2020), Case Study: French Motor Third-Party Liability Claims, SSRN.
oe = OneHotEncoder(sparse_output=False)
X_train_oh = oe.fit_transform(X_train[["Region"]])
X_test_oh = oe.transform(X_test[["Region"]])
print(list(X_train["Region"][:5]))
X_train_oh.head()
['R24', 'R93', 'R11', 'R42', 'R24']
Region_R11 | Region_R21 | Region_R22 | Region_R23 | Region_R24 | Region_R25 | Region_R26 | Region_R31 | Region_R41 | Region_R42 | ... | Region_R53 | Region_R54 | Region_R72 | Region_R73 | Region_R74 | Region_R82 | Region_R83 | Region_R91 | Region_R93 | Region_R94 | |
---|---|---|---|---|---|---|---|---|---|---|---|---|---|---|---|---|---|---|---|---|---|
0 | 0.0 | 0.0 | 0.0 | 0.0 | 1.0 | 0.0 | 0.0 | 0.0 | 0.0 | 0.0 | ... | 0.0 | 0.0 | 0.0 | 0.0 | 0.0 | 0.0 | 0.0 | 0.0 | 0.0 | 0.0 |
1 | 0.0 | 0.0 | 0.0 | 0.0 | 0.0 | 0.0 | 0.0 | 0.0 | 0.0 | 0.0 | ... | 0.0 | 0.0 | 0.0 | 0.0 | 0.0 | 0.0 | 0.0 | 0.0 | 1.0 | 0.0 |
... | ... | ... | ... | ... | ... | ... | ... | ... | ... | ... | ... | ... | ... | ... | ... | ... | ... | ... | ... | ... | ... |
3 | 0.0 | 0.0 | 0.0 | 0.0 | 0.0 | 0.0 | 0.0 | 0.0 | 0.0 | 1.0 | ... | 0.0 | 0.0 | 0.0 | 0.0 | 0.0 | 0.0 | 0.0 | 0.0 | 0.0 | 0.0 |
4 | 0.0 | 0.0 | 0.0 | 0.0 | 1.0 | 0.0 | 0.0 | 0.0 | 0.0 | 0.0 | ... | 0.0 | 0.0 | 0.0 | 0.0 | 0.0 | 0.0 | 0.0 | 0.0 | 0.0 | 0.0 |
5 rows × 22 columns
num_regions = len(oe.categories_[0])
random.seed(12)
model = Sequential([
Dense(2, input_dim=num_regions),
Dense(1, activation="exponential")
])
model.compile(optimizer="adam", loss="poisson")
es = EarlyStopping(verbose=True)
hist = model.fit(X_train_oh, y_train, epochs=100, verbose=0,
validation_split=0.2, callbacks=[es])
hist.history["val_loss"][-1]
Epoch 12: early stopping
0.7526934146881104
every_category = pd.DataFrame(np.eye(num_regions), columns=oe.categories_[0])
every_category.head(3)
R11 | R21 | R22 | R23 | R24 | R25 | R26 | R31 | R41 | R42 | ... | R53 | R54 | R72 | R73 | R74 | R82 | R83 | R91 | R93 | R94 | |
---|---|---|---|---|---|---|---|---|---|---|---|---|---|---|---|---|---|---|---|---|---|
0 | 1.0 | 0.0 | 0.0 | 0.0 | 0.0 | 0.0 | 0.0 | 0.0 | 0.0 | 0.0 | ... | 0.0 | 0.0 | 0.0 | 0.0 | 0.0 | 0.0 | 0.0 | 0.0 | 0.0 | 0.0 |
1 | 0.0 | 1.0 | 0.0 | 0.0 | 0.0 | 0.0 | 0.0 | 0.0 | 0.0 | 0.0 | ... | 0.0 | 0.0 | 0.0 | 0.0 | 0.0 | 0.0 | 0.0 | 0.0 | 0.0 | 0.0 |
2 | 0.0 | 0.0 | 1.0 | 0.0 | 0.0 | 0.0 | 0.0 | 0.0 | 0.0 | 0.0 | ... | 0.0 | 0.0 | 0.0 | 0.0 | 0.0 | 0.0 | 0.0 | 0.0 | 0.0 | 0.0 |
3 rows × 22 columns
<tf.Tensor: shape=(22, 2), dtype=float32, numpy=
array([[-0.21, -0.14],
[ 0.21, -0.17],
[-0.22, 0.1 ],
[-0.83, 0.1 ],
[-0.01, -0.66],
[-0.65, -0.13],
[-0.36, -0.41],
[ 0.21, -0.03],
[-0.93, -0.57],
[ 0.2 , -0.41],
[-0.43, -0.21],
[-1.13, -0.33],
[ 0.17, -0.68],
[-0.88, -0.55],
[-0.13, 0.05],
[ 0.11, 0. ],
[-0.46, -0.38],
[-0.62, -0.37],
[-0.19, -0.28],
[-0.22, 0.15],
[ 0.3 , -0.16],
[-0.28, 0.36]], dtype=float32)>
((22, 22), (22, 2), (2,))
array([[-0.21, -0.14],
[ 0.21, -0.17],
[-0.22, 0.1 ],
[-0.83, 0.1 ],
[-0.01, -0.66],
[-0.65, -0.13],
[-0.36, -0.41],
[ 0.21, -0.03],
[-0.93, -0.57],
[ 0.2 , -0.41],
[-0.43, -0.21],
[-1.13, -0.33],
[ 0.17, -0.68],
[-0.88, -0.55],
[-0.13, 0.05],
[ 0.11, 0. ],
[-0.46, -0.38],
[-0.62, -0.37],
[-0.19, -0.28],
[-0.22, 0.15],
[ 0.3 , -0.16],
[-0.28, 0.36]])
array([[-0.21, -0.14],
[ 0.21, -0.17],
[-0.22, 0.1 ],
[-0.83, 0.1 ],
[-0.01, -0.66],
[-0.65, -0.13],
[-0.36, -0.41],
[ 0.21, -0.03],
[-0.93, -0.57],
[ 0.2 , -0.41],
[-0.43, -0.21],
[-1.13, -0.33],
[ 0.17, -0.68],
[-0.88, -0.55],
[-0.13, 0.05],
[ 0.11, 0. ],
[-0.46, -0.38],
[-0.62, -0.37],
[-0.19, -0.28],
[-0.22, 0.15],
[ 0.3 , -0.16],
[-0.28, 0.36]], dtype=float32)
oe = OrdinalEncoder()
X_train_reg = oe.fit_transform(X_train[["Region"]])
X_test_reg = oe.transform(X_test[["Region"]])
for i, reg in enumerate(oe.categories_[0][:3]):
print(f"The Region value {reg} gets turned into {i}.")
The Region value R11 gets turned into 0.
The Region value R21 gets turned into 1.
The Region value R22 gets turned into 2.
array([[-0.12, -0.11],
[ 0.03, -0. ],
[-0.02, 0.01],
[-0.25, -0.14],
[-0.28, -0.32],
[-0.3 , -0.22],
[-0.31, -0.28],
[ 0.1 , 0.07],
[-0.61, -0.51],
[-0.06, -0.12],
[-0.17, -0.14],
[-0.6 , -0.46],
[-0.22, -0.27],
[-0.59, -0.5 ],
[-0. , 0.02],
[ 0.07, 0.06],
[-0.31, -0.28],
[-0.4 , -0.34],
[-0.16, -0.15],
[ 0.01, 0.05],
[ 0.08, 0.03],
[ 0.08, 0.13]], dtype=float32)
Source: Marcus Lautier (2022).
We can’t do this with Sequential models…
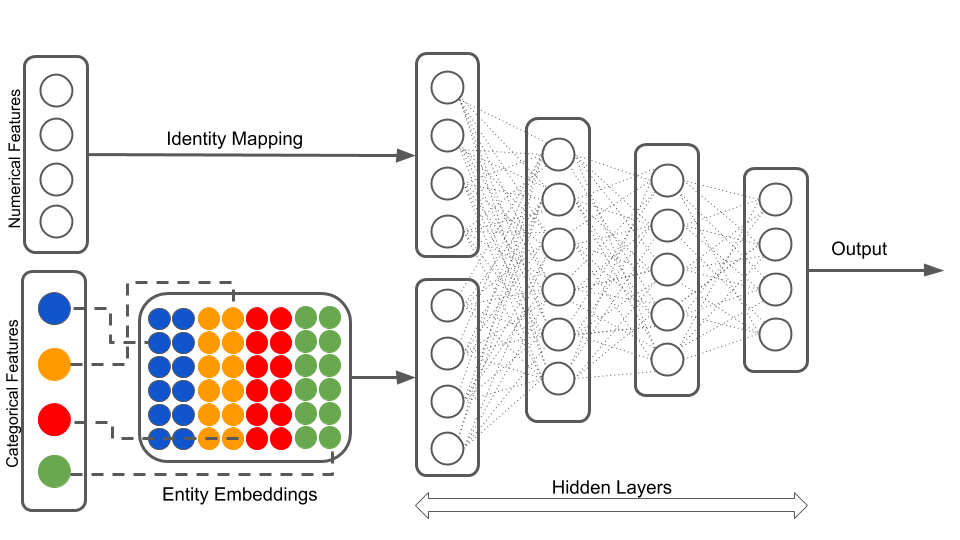
Source: LotusLabs Blog, Accurate insurance claims prediction with Deep Learning.
Lecture Outline
Entity Embedding
Categorical Variables & Entity Embeddings
Keras’ Functional API
French Motor Dataset with Embeddings
Scale By Exposure
random.seed(12)
inputs = Input(shape=(X_train_oh.shape[1],))
x = Dense(30, "leaky_relu")(inputs)
out = Dense(1, "exponential")(x)
model = Model(inputs, out)
model.compile(
optimizer="adam",
loss="poisson")
hist = model.fit(
X_train_oh, y_train,
epochs=1, verbose=0,
validation_split=0.2)
hist.history["val_loss"][-1]
0.7535399198532104
See one-length tuples.
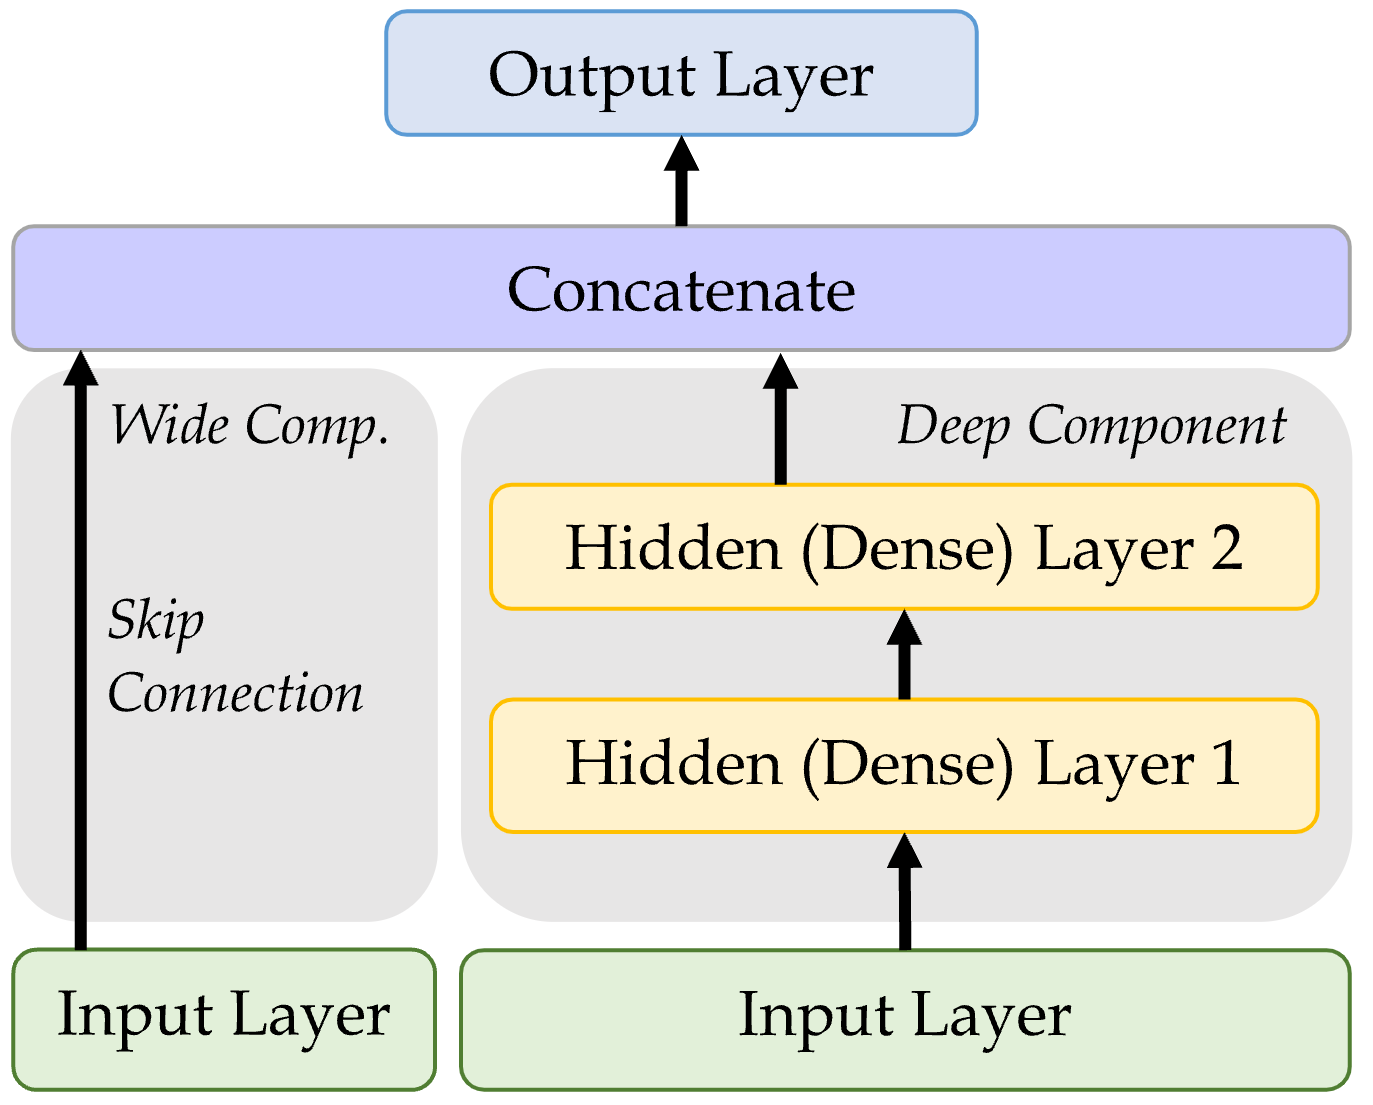
Add a skip connection from input to output layers.
Sources: Marcus Lautier (2022) & Aurélien Géron (2019), Hands-On Machine Learning with Scikit-Learn, Keras, and TensorFlow, 2nd Edition, Chapter 10 code snippet.
For complex networks, it is often useful to give meaningul names to the layers.
input_ = Input(shape=X_train.shape[1:], name="input")
hidden1 = Dense(30, activation="leaky_relu", name="hidden1")(input_)
hidden2 = Dense(30, activation="leaky_relu", name="hidden2")(hidden1)
concat = Concatenate(name="combined")([input_, hidden2])
output = Dense(1, name="output")(concat)
model = Model(inputs=[input_], outputs=[output])
Model: "functional_8"
┏━━━━━━━━━━━━━━━━━━━━━┳━━━━━━━━━━━━━━━━━━━┳━━━━━━━━━━━┳━━━━━━━━━━━━━━━━━━━┓ ┃ Layer (type) ┃ Output Shape ┃ Param # ┃ Connected to ┃ ┡━━━━━━━━━━━━━━━━━━━━━╇━━━━━━━━━━━━━━━━━━━╇━━━━━━━━━━━╇━━━━━━━━━━━━━━━━━━━┩ │ input (InputLayer) │ (None, 10) │ 0 │ - │ ├─────────────────────┼───────────────────┼───────────┼───────────────────┤ │ hidden1 (Dense) │ (None, 30) │ 330 │ input[0][0] │ ├─────────────────────┼───────────────────┼───────────┼───────────────────┤ │ hidden2 (Dense) │ (None, 30) │ 930 │ hidden1[0][0] │ ├─────────────────────┼───────────────────┼───────────┼───────────────────┤ │ combined │ (None, 40) │ 0 │ input[0][0], │ │ (Concatenate) │ │ │ hidden2[0][0] │ ├─────────────────────┼───────────────────┼───────────┼───────────────────┤ │ output (Dense) │ (None, 1) │ 41 │ combined[0][0] │ └─────────────────────┴───────────────────┴───────────┴───────────────────┘
Total params: 1,301 (5.08 KB)
Trainable params: 1,301 (5.08 KB)
Non-trainable params: 0 (0.00 B)
Lecture Outline
Entity Embedding
Categorical Variables & Entity Embeddings
Keras’ Functional API
French Motor Dataset with Embeddings
Scale By Exposure
Source: LotusLabs Blog, Accurate insurance claims prediction with Deep Learning.
Transform the categorical variables to integers:
Split the brand and region data apart from the rest:
Make a Keras Input
for: vehicle brand, region, & others.
Create embeddings and join them with the other inputs.
from keras.layers import Reshape
random.seed(1337)
veh_brand_ee = Embedding(input_dim=num_brands, output_dim=2,
name="vehBrandEE")(veh_brand)
veh_brand_ee = Reshape(target_shape=(2,))(veh_brand_ee)
region_ee = Embedding(input_dim=num_regions, output_dim=2,
name="regionEE")(region)
region_ee = Reshape(target_shape=(2,))(region_ee)
x = Concatenate(name="combined")([veh_brand_ee, region_ee, other_inputs])
Feed the combined embeddings & continuous inputs to some normal dense layers.
x = Dense(30, "relu", name="hidden")(x)
out = Dense(1, "exponential", name="out")(x)
model = Model([veh_brand, region, other_inputs], out)
model.compile(optimizer="adam", loss="poisson")
hist = model.fit((X_train_brand, X_train_region, X_train_rest),
y_train, epochs=100, verbose=0,
callbacks=[EarlyStopping(patience=5)], validation_split=0.2)
np.min(hist.history["val_loss"])
0.6692155599594116
Lecture Outline
Entity Embedding
Categorical Variables & Entity Embeddings
Keras’ Functional API
French Motor Dataset with Embeddings
Scale By Exposure
Have \{ (\mathbf{x}_i, y_i) \}_{i=1, \dots, n} for \mathbf{x}_i \in \mathbb{R}^{47} and y_i \in \mathbb{N}_0.
Model 1: Say Y_i \sim \mathsf{Poisson}(\lambda(\mathbf{x}_i)).
But, the exposures are different for each policy. \lambda(\mathbf{x}_i) is the expected number of claims for the duration of policy i’s contract.
Model 2: Say Y_i \sim \mathsf{Poisson}(\text{Exposure}_i \times \lambda(\mathbf{x}_i)).
Now, \text{Exposure}_i \not\in \mathbf{x}_i, and \lambda(\mathbf{x}_i) is the rate per year.
Split exposure apart from the rest:
Organise the inputs:
Feed the continuous inputs to some normal dense layers.
out = lambda_ * exposure # In past, need keras.layers.Multiply()[lambda_, exposure]
model = Model([exposure, other_inputs], out)
model.compile(optimizer="adam", loss="poisson")
es = EarlyStopping(patience=10, restore_best_weights=True, verbose=1)
hist = model.fit((X_train_exp, X_train_rest),
y_train, epochs=100, verbose=0,
callbacks=[es], validation_split=0.2)
np.min(hist.history["val_loss"])
Epoch 40: early stopping
Restoring model weights from the end of the best epoch: 30.
0.8829042911529541
from watermark import watermark
print(watermark(python=True, packages="keras,matplotlib,numpy,pandas,seaborn,scipy,torch,tensorflow,tf_keras"))
Python implementation: CPython
Python version : 3.11.9
IPython version : 8.24.0
keras : 3.3.3
matplotlib: 3.9.0
numpy : 1.26.4
pandas : 2.2.2
seaborn : 0.13.2
scipy : 1.11.0
torch : 2.3.1
tensorflow: 2.16.1
tf_keras : 2.16.0