AI & Deep Learning

ACTL3143 & ACTL5111 Deep Learning for Actuaries

Patrick Laub

Artificial Intelligence

Lecture Outline

  • Artificial Intelligence

  • Deep Learning Successes (Images)

  • Deep Learning Successes (Text)

  • Classifying Machine Learning Tasks

  • Neural Networks

  • California House Price Prediction

  • Our First Neural Network

  • Force positive predictions

  • Preprocessing

  • Early Stopping

Different goals of AI

Artificial intelligence describes an agent which is capable of:

Thinking humanly Thinking rationally
Acting humanly Acting rationally

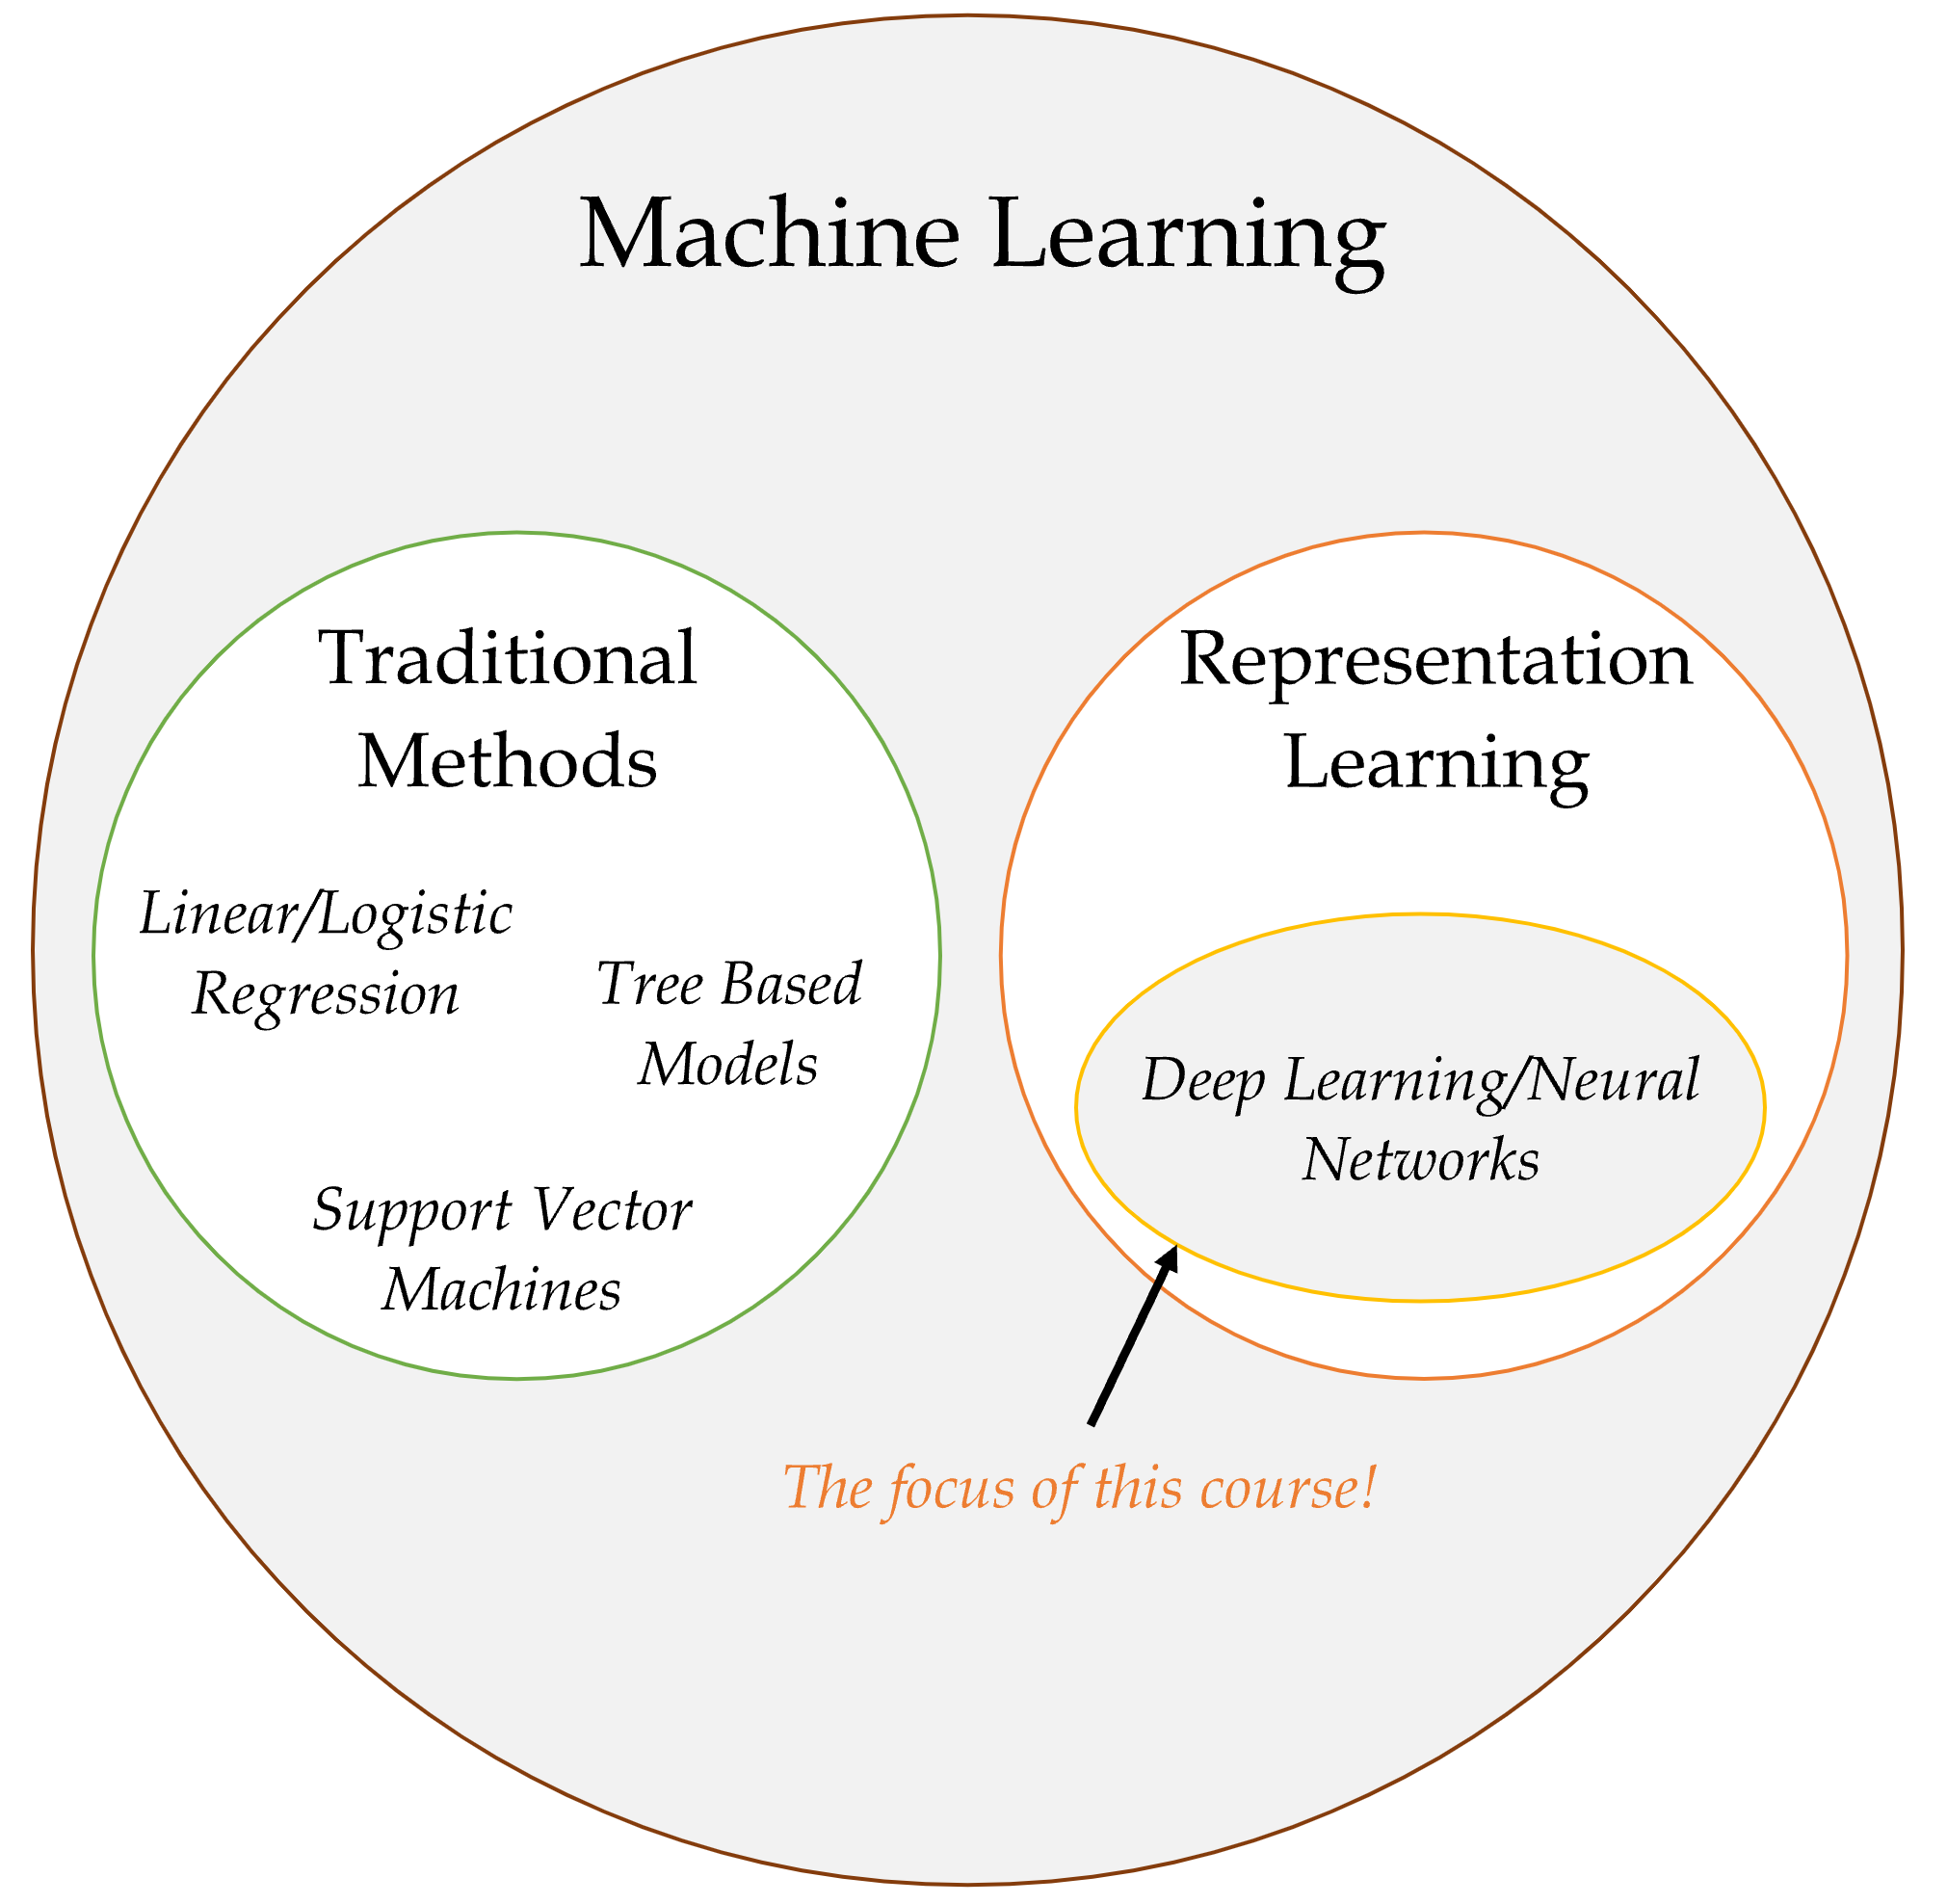
AI eventually become dominated by one approach, called machine learning, which itself is now dominated by deep learning (neural networks).

There are AI algorithms for simple tasks that don’t use machine learning though.

You can study a 12 week course on AI and never touch on machine learning…
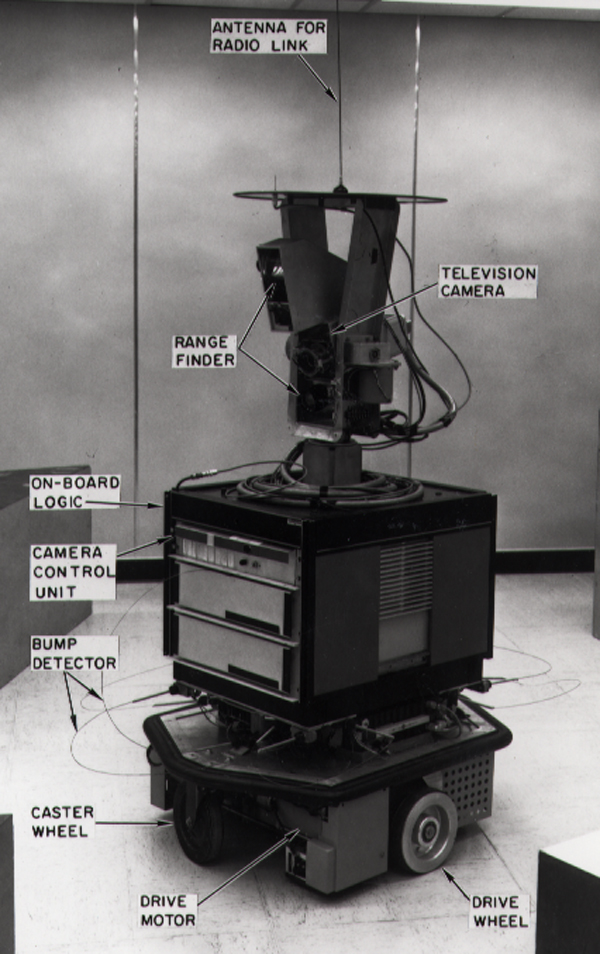
Shakey the Robot (~1966 – 1972)

Shakey the Robot


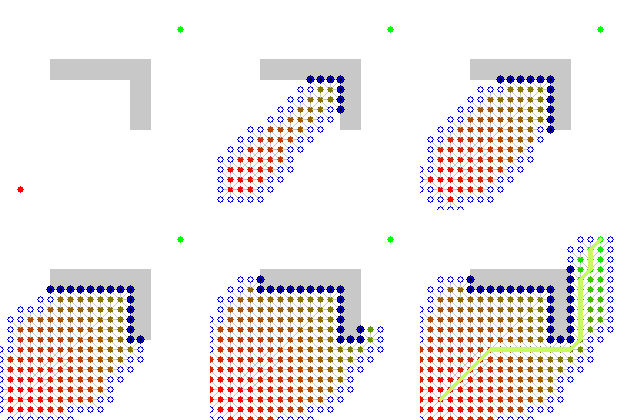
Route-finding I

At its core, a pathfinding method searches a graph by starting at one vertex and exploring adjacent nodes until the destination node is reached, generally with the intent of finding the cheapest route. Although graph searching methods such as a breadth-first search would find a route if given enough time, other methods, which “explore” the graph, would tend to reach the destination sooner. An analogy would be a person walking across a room; rather than examining every possible route in advance, the person would generally walk in the direction of the destination and only deviate from the path to avoid an obstruction, and make deviations as minor as possible. (Source: Wikipedia)


A* algorithm (1968).

Used in every GPS/Navigation app and…

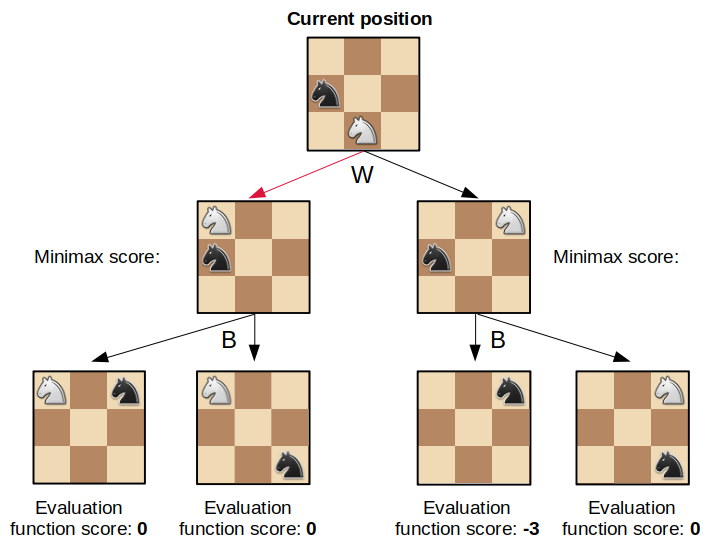
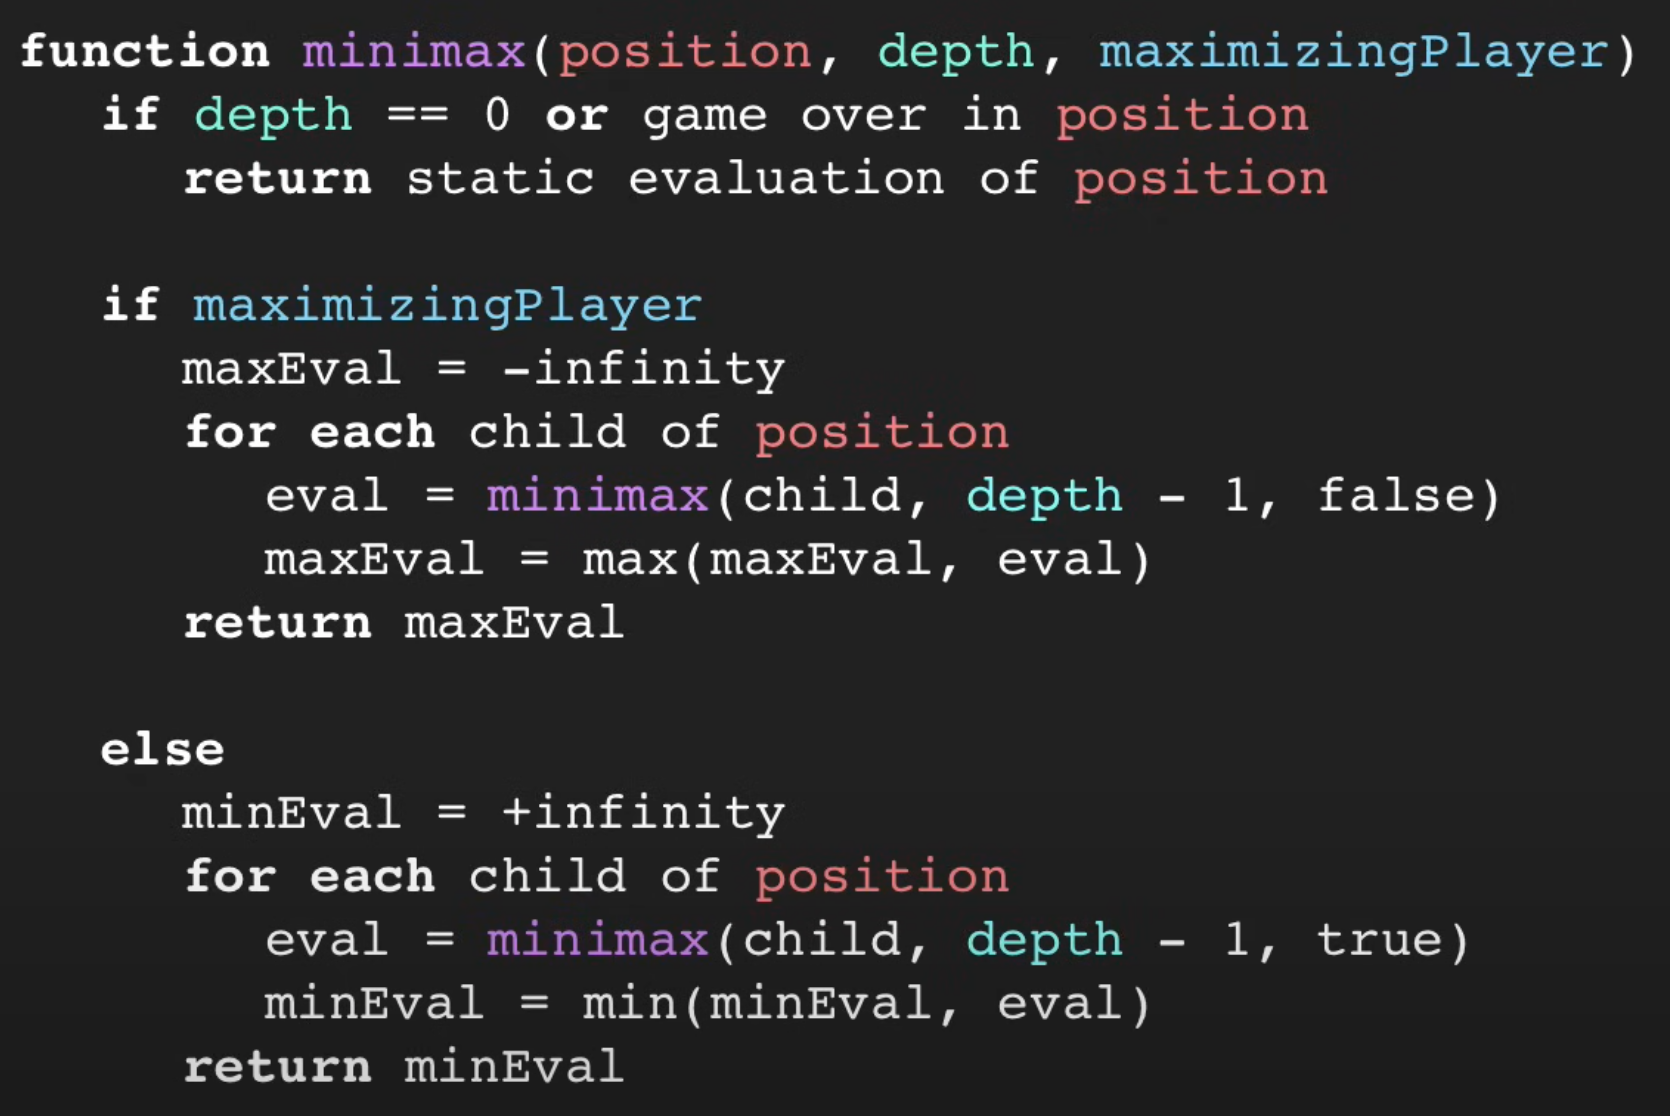
The minimax algorithm

The minimax algorithm for chess.

Pseudocode for the minimax algorithm.

Chess

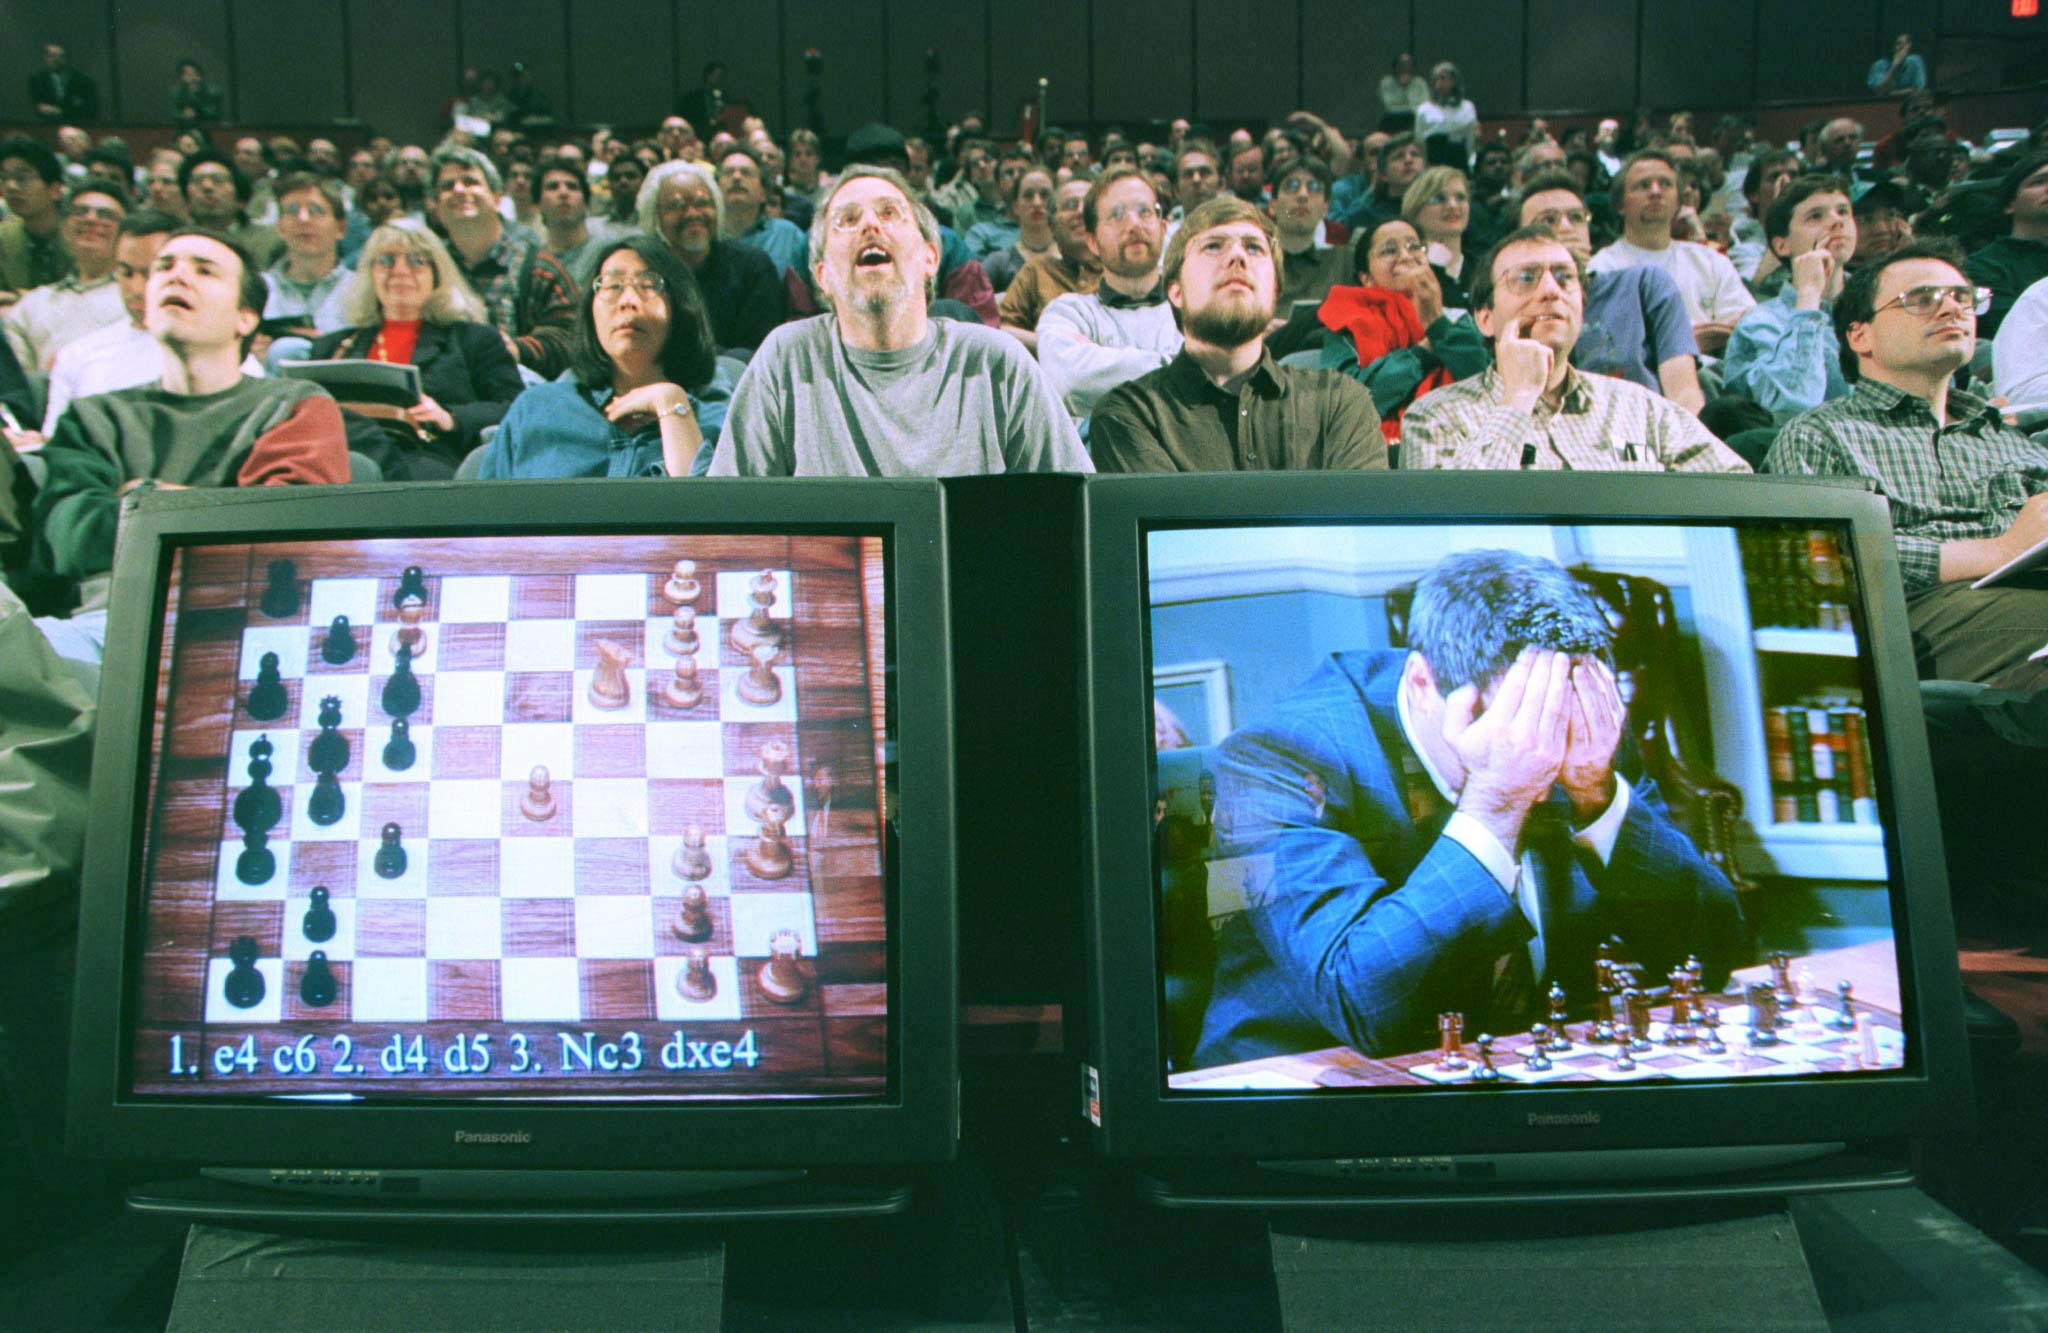
Deep Blue (1997)

Gary Kasparov playing Deep Blue.

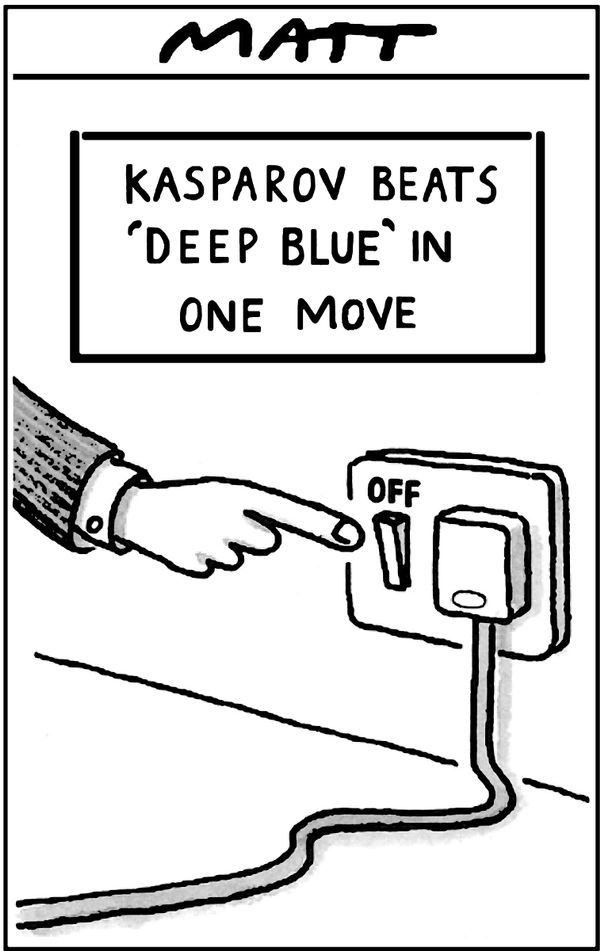
Cartoon of the match.

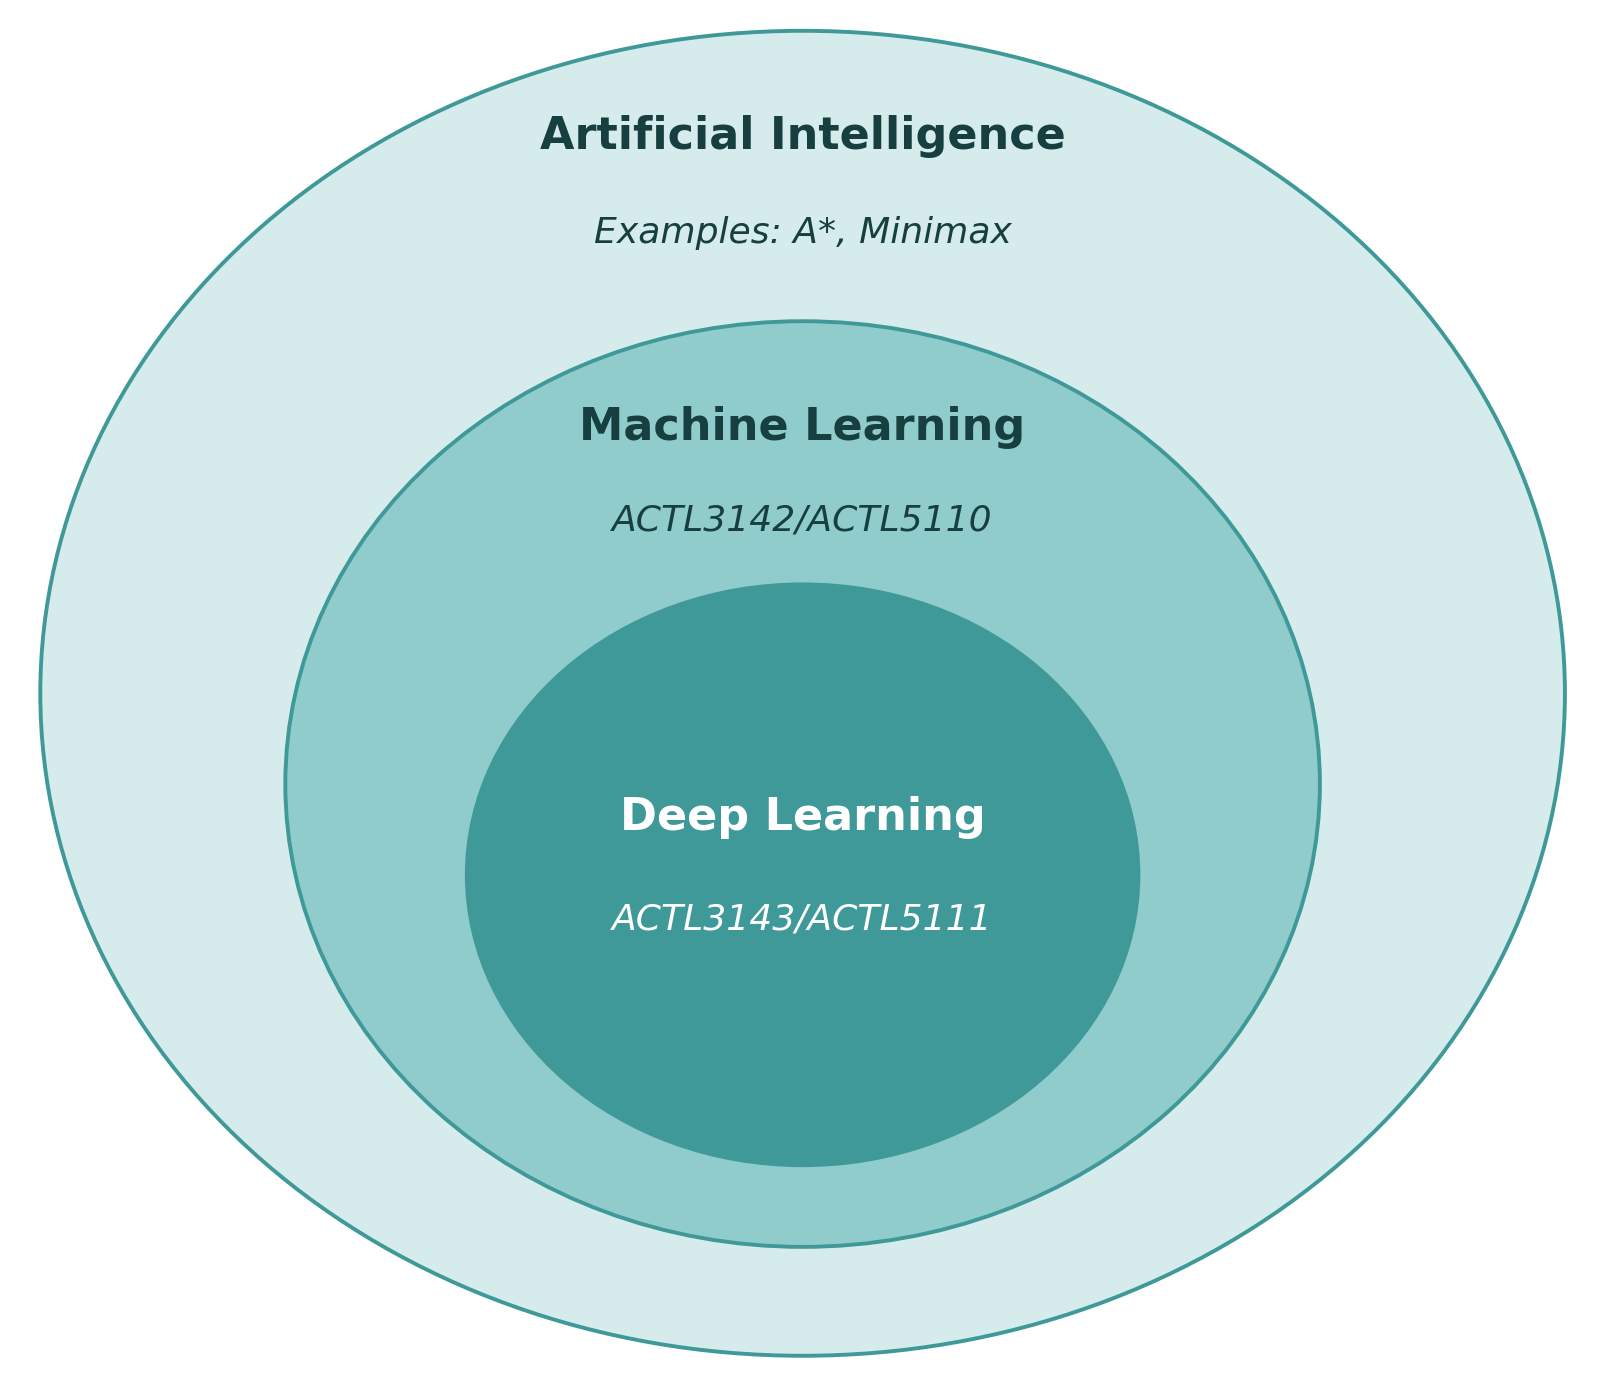
Machine Learning

Tried making a computer smart, too hard!

Make a computer that can learn to be smart.

The Venn diagram of Artificial Intelligence, Machine Learning, Neural Networks and Deep Learning. Adapted from (Shang et al., 2025).

Definition

“[Machine Learning is the] field of study that gives computers the ability to learn without being explicitly programmed” Arthur Samuel (1959)

Deep Learning Successes (Images)

Lecture Outline

  • Artificial Intelligence

  • Deep Learning Successes (Images)

  • Deep Learning Successes (Text)

  • Classifying Machine Learning Tasks

  • Neural Networks

  • California House Price Prediction

  • Our First Neural Network

  • Force positive predictions

  • Preprocessing

  • Early Stopping

Image Classification I

What is this?

Options:

  1. punching bag
  2. goblet
  3. red wine
  4. hourglass
  5. balloon

Note

Hover over the options to see AI’s prediction (i.e. the probability of the photo being in that category).

Image Classification II

What is this?

Options:

  1. sea urchin
  2. porcupine
  3. echidna
  4. platypus
  5. quill

Image Classification III

What is this?
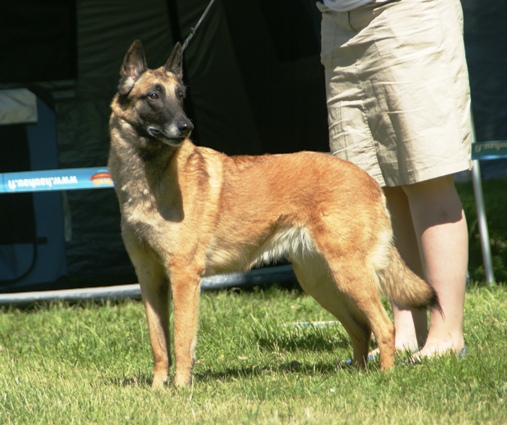
Options:

  1. dingo
  2. malinois
  3. German shepherd
  4. muzzle
  5. kelpie

ImageNet Challenge

ImageNet and the ImageNet Large Scale Visual Recognition Challenge (ILSVRC); originally 1,000 synsets.
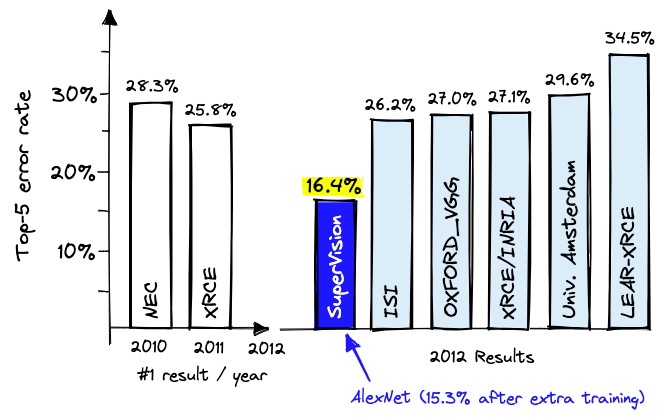
AlexNet — a neural network developed by Alex Krizhevsky, Ilya Sutskever, and Geoffrey Hinton — won the ILSVRC 2012 challenge convincingly.

How were the images labelled?

The original ‘mechanical turk’ (1770)

“Two years later, the first version of ImageNet was released with 12 million images structured and labeled in line with the WordNet ontology. If one person had annotated one image/minute and did nothing else in those two years (including sleeping or eating), it would have taken 22 years and 10 months.

To do this in under two years, Li turned to Amazon Mechanical Turk, a crowdsourcing platform where anyone can hire people from around the globe to perform tasks cost-effectively.”

Needed a graphics card

A graphics processing unit (GPU)
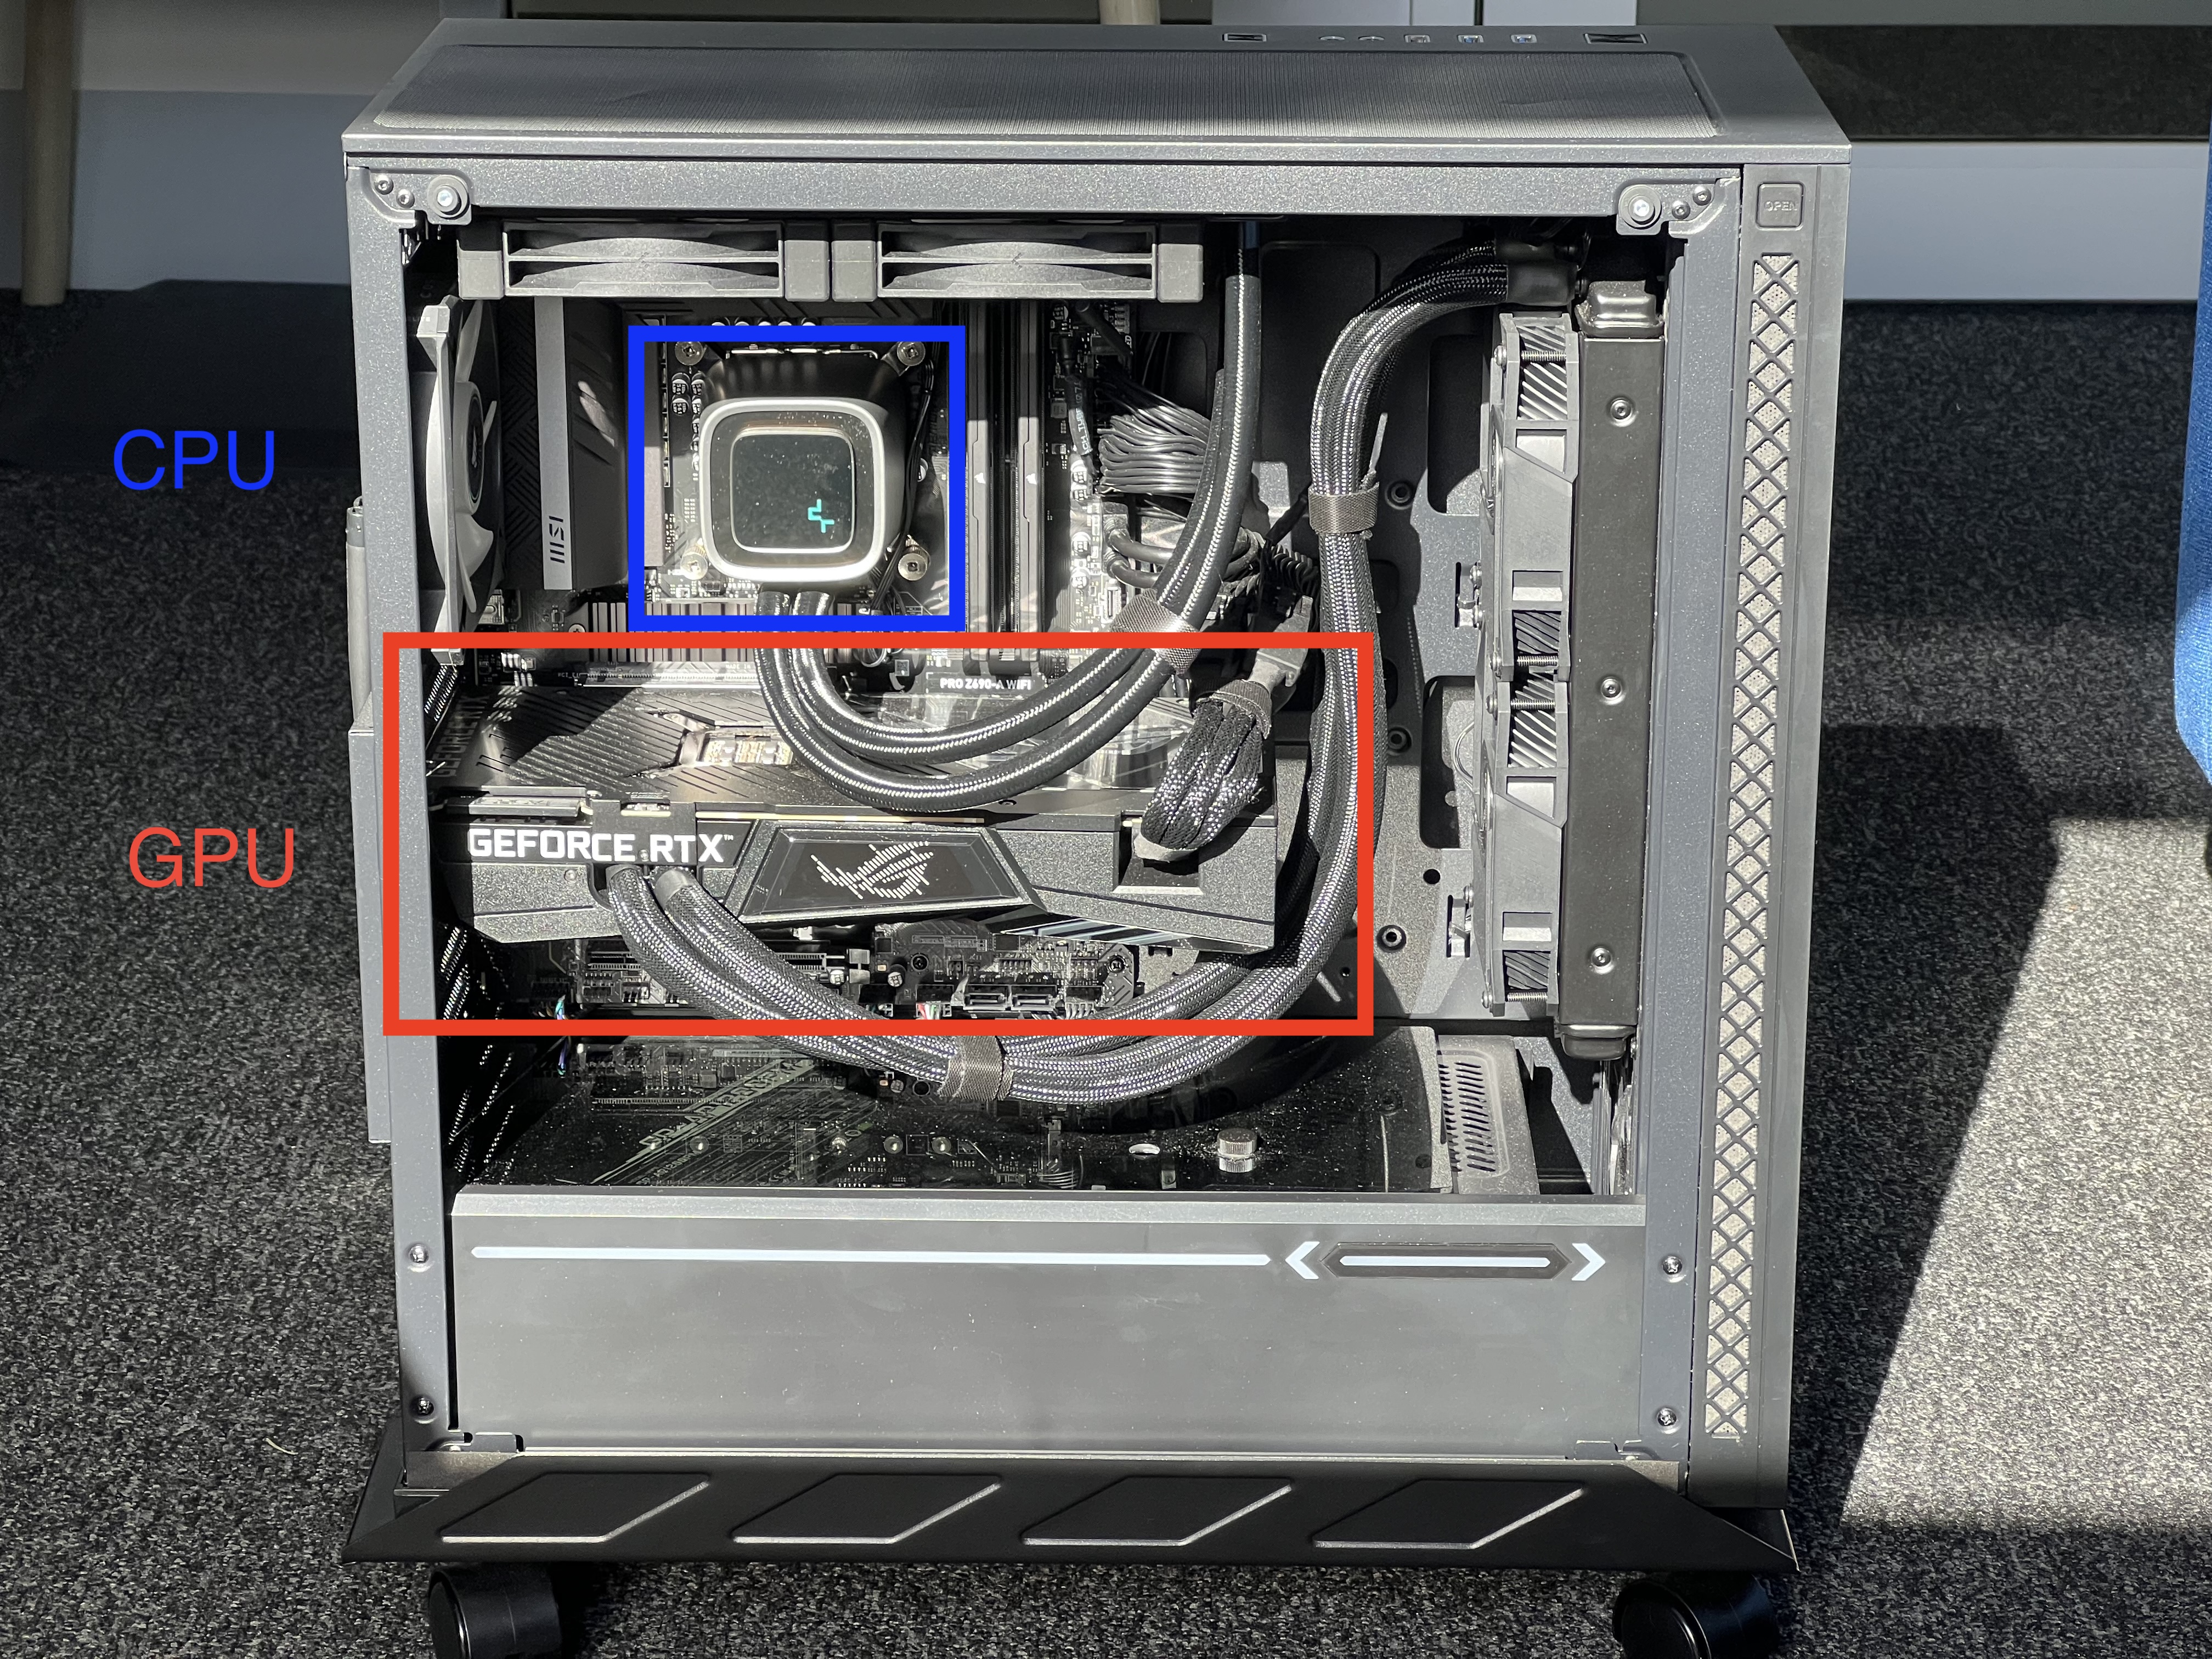
A PC with the GPU and CPU marked in red and blue.

4.2. Training on multiple GPUs A single GTX 580 GPU has only 3GB of memory, which limits the maximum size of the networks that can be trained on it. It turns out that 1.2 million training examples are enough to train networks which are too big to fit on one GPU. Therefore we spread the net across two GPUs.”

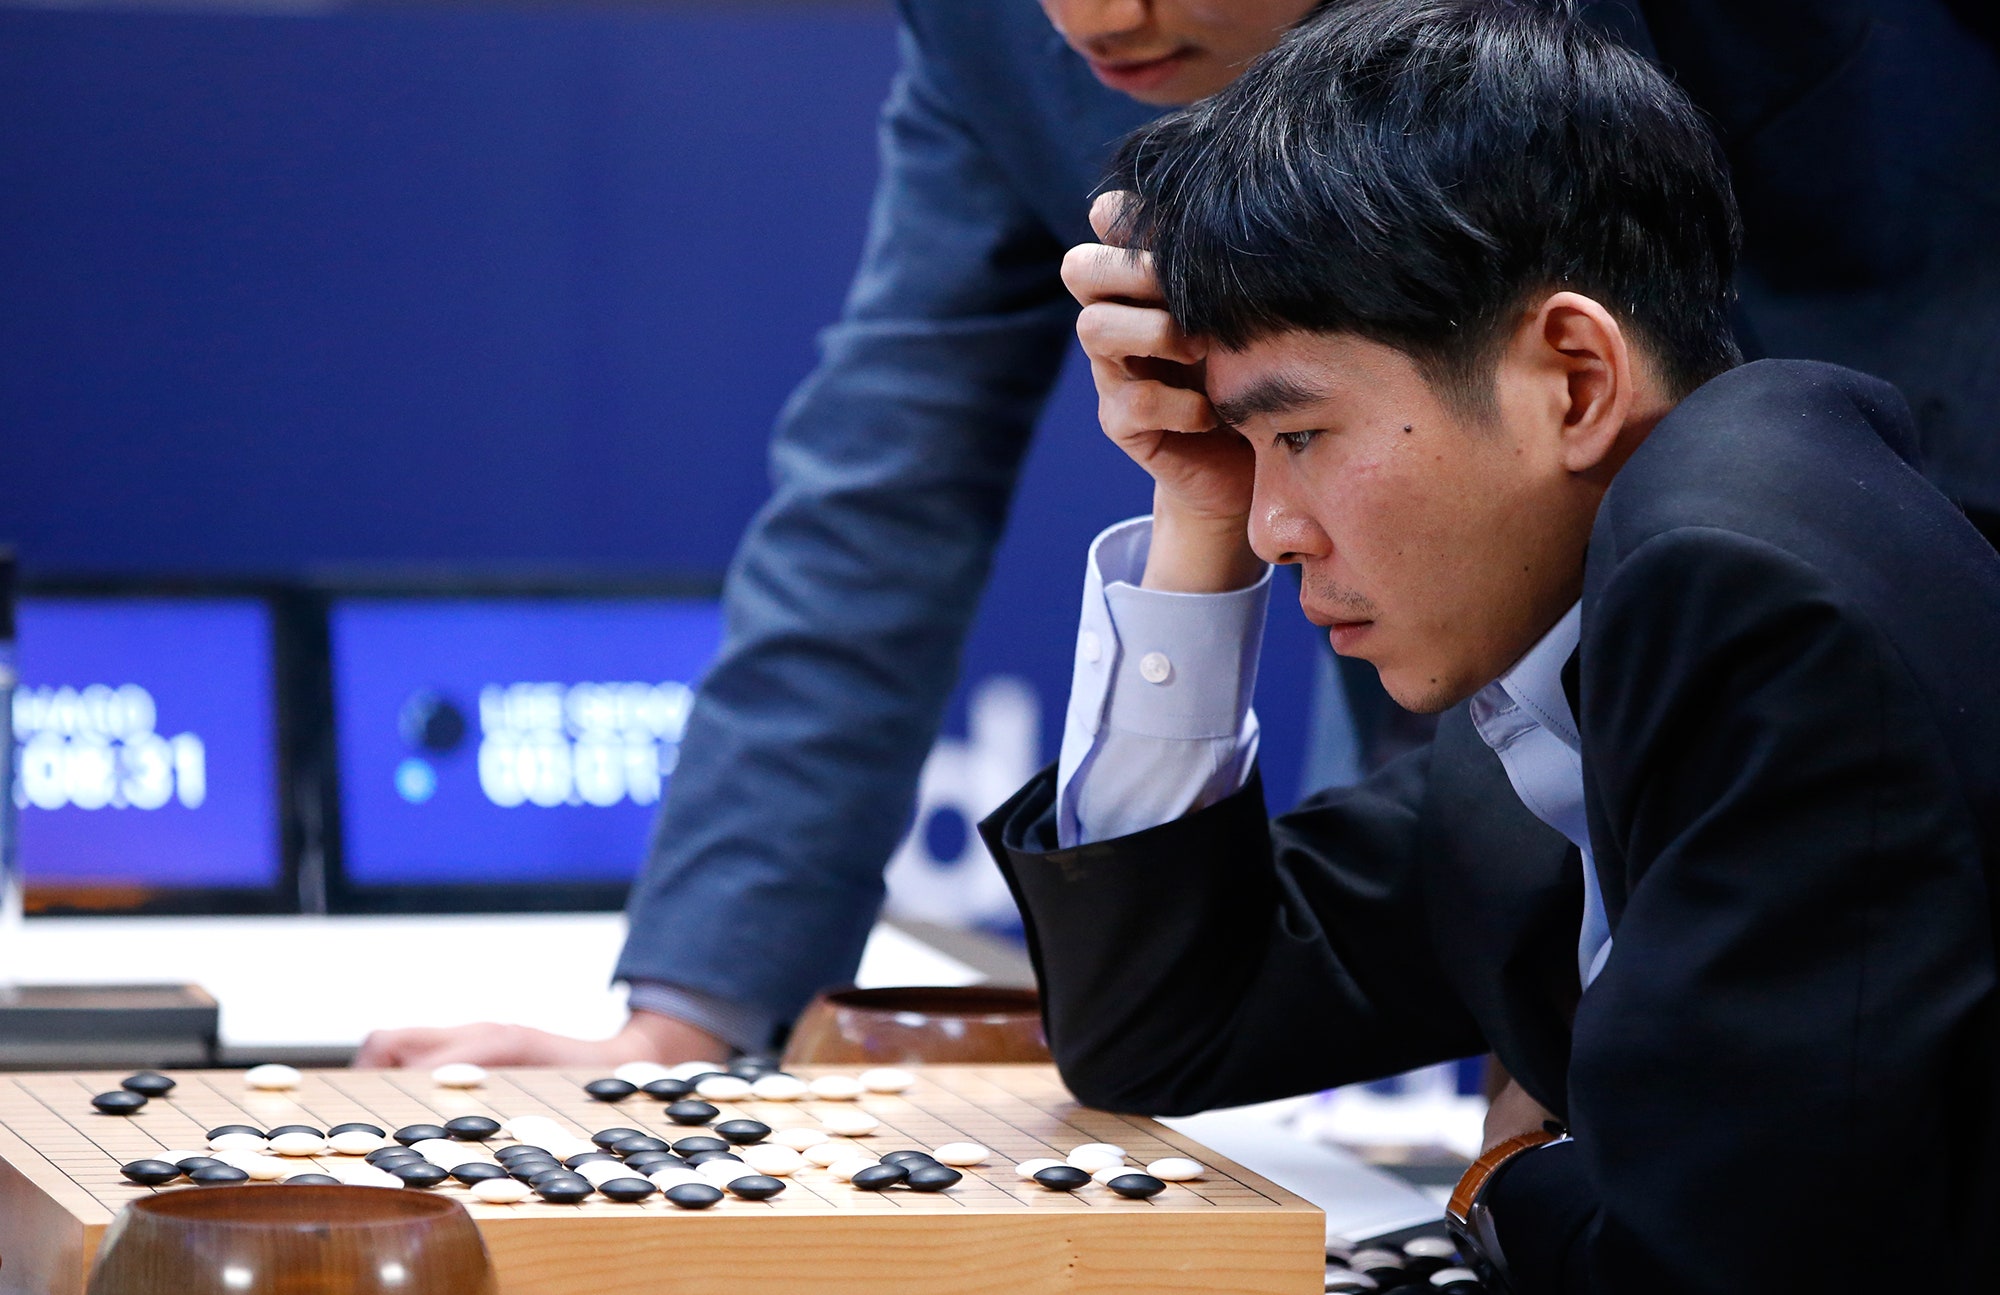
Lee Sedol plays AlphaGo (2016)

Deep Blue was a win for AI, AlphaGo a win for ML.

Lee Sedol playing AlphaGo AI

I highly recommend this documentary about the event.

Generative Adversarial Networks (2014)

https://thispersondoesnotexist.com/

A GAN-generated face

A GAN-generated face

Diffusion models

Painting of avocado skating while wearing a hoodie

A surrealist painting of an alpaca studying for an exam

Deep Learning Successes (Text)

Lecture Outline

  • Artificial Intelligence

  • Deep Learning Successes (Images)

  • Deep Learning Successes (Text)

  • Classifying Machine Learning Tasks

  • Neural Networks

  • California House Price Prediction

  • Our First Neural Network

  • Force positive predictions

  • Preprocessing

  • Early Stopping

GPT

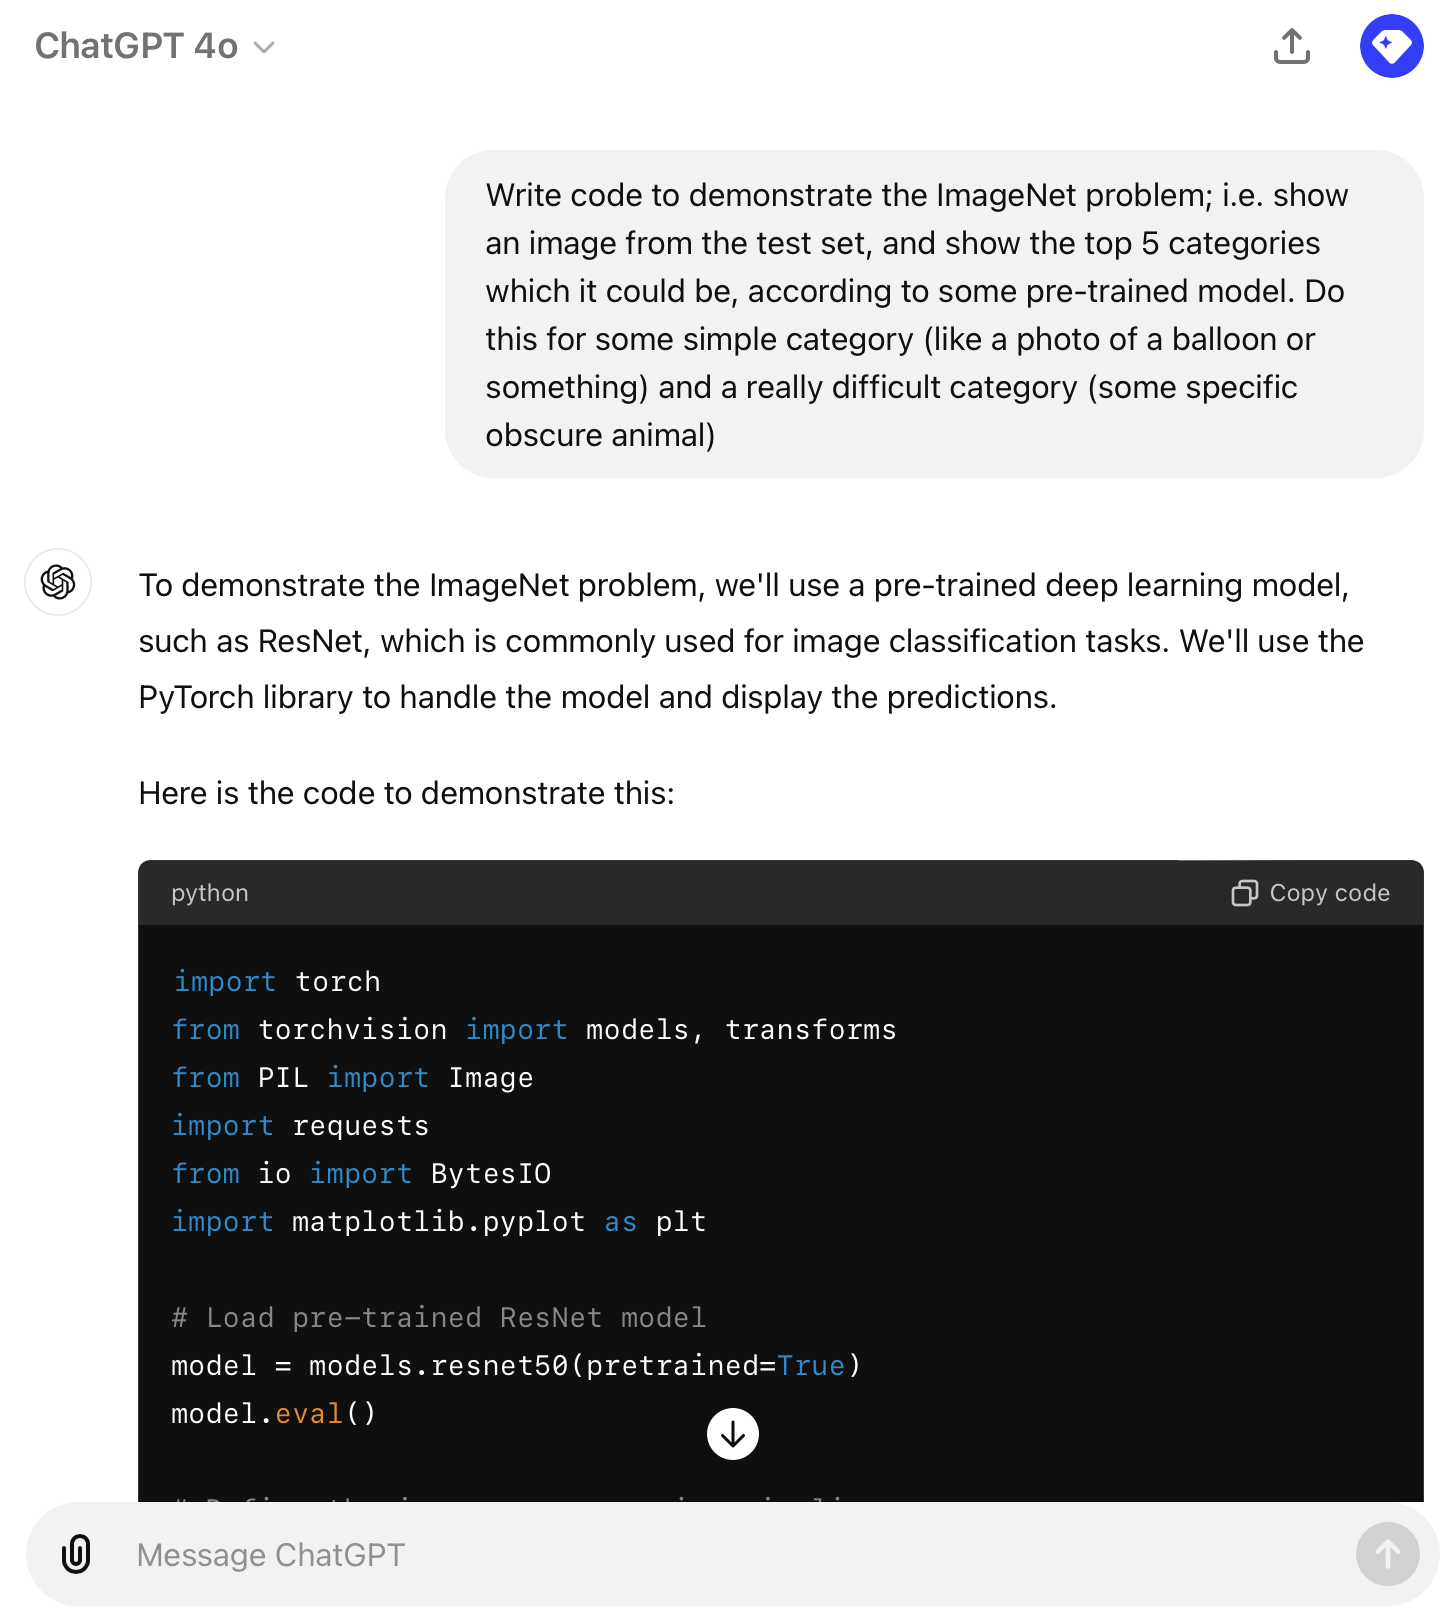
AI predictions in the classification demo were from GPT code.

Homework Get ChatGPT to:

  • generate images
  • translate code
  • explain code
  • run code
  • analyse a dataset
  • critique code
  • critique writing
  • voice chat with you

Compare to Copilot.

Code generation (GitHub Copilot)

Students get extra Copilot for free

Use a free trial then sign up for free education account

A student post from last year:

I strongly recommend taking a photo holding up your Academic Statement to your phone’s front facing camera when getting verified for the student account on GitHub. No other method of taking/uploading photo proofs worked for me. Furthermore, I had to make sure the name on the statement matched my profile exactly and also had to put in a bio.

Good luck with this potentially annoying process!

Homework It’s a slow process, so get this going early.

Classifying Machine Learning Tasks

Lecture Outline

  • Artificial Intelligence

  • Deep Learning Successes (Images)

  • Deep Learning Successes (Text)

  • Classifying Machine Learning Tasks

  • Neural Networks

  • California House Price Prediction

  • Our First Neural Network

  • Force positive predictions

  • Preprocessing

  • Early Stopping

A taxonomy of problems

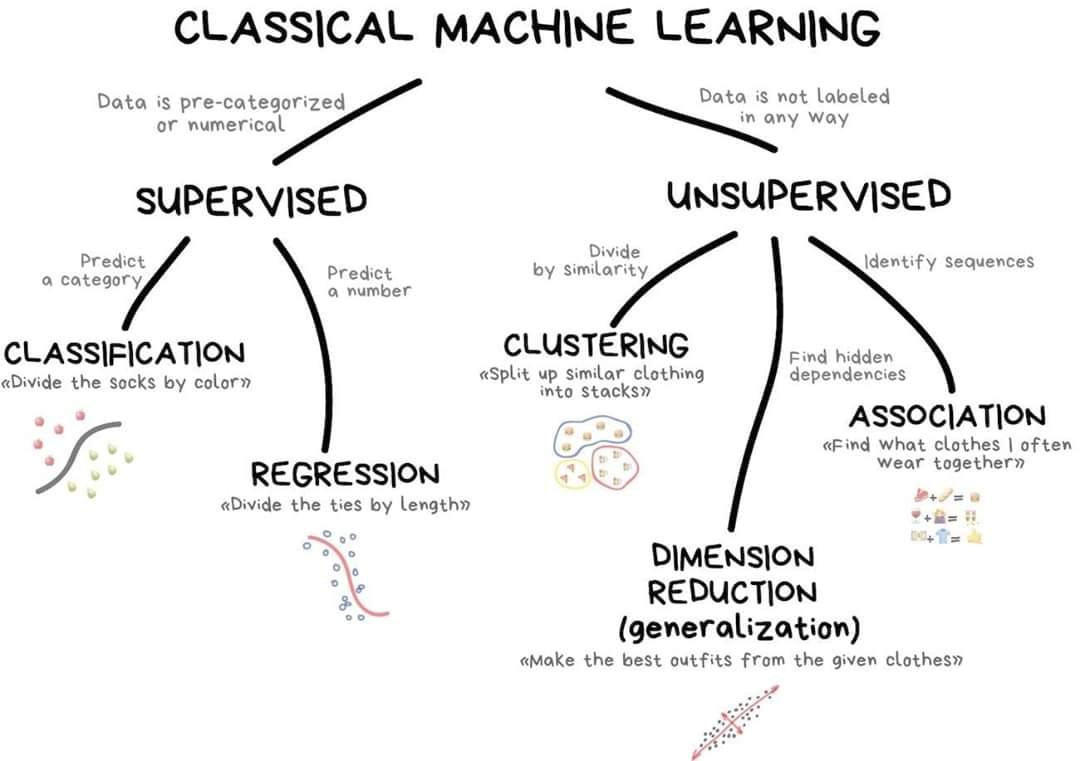
Machine learning categories in ACTL3142.

New ones:

  • Reinforcement learning
  • Semi-supervised learning
  • Active learning

Supervised learning

The main focus of this course.

Regression

  • Given policy \hookrightarrow predict the rate of claims.
  • Given policy \hookrightarrow predict claim severity.
  • Given a reserving triangle \hookrightarrow predict future claims.

Classification

  • Given a claim \hookrightarrow classify as fraudulent or not.
  • Given a customer \hookrightarrow predict customer retention patterns.

Supervised learning: mathematically

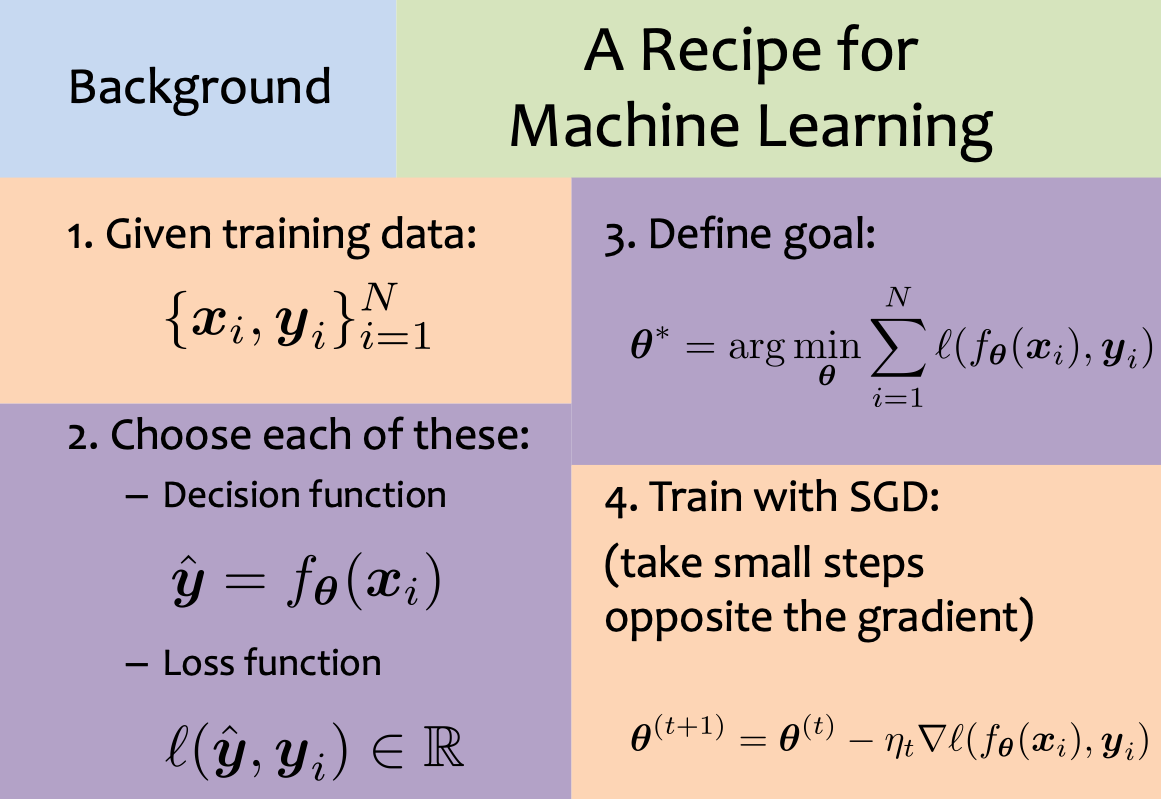
A recipe for supervised learning.

Self-supervised learning

Data which ‘labels itself’. Example: language model.
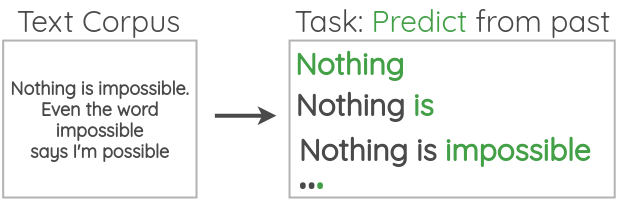
‘Autoregressive’ (e.g. GPT) versus ‘masked’ model (e.g. BERT).

Example: image inpainting

Original image

Randomly remove a part

Try to fill it in from context

Other examples: image super-resolution, denoising images.

Example: Deoldify images #1

A deoldified version of the famous “Migrant Mother” photograph.

Example: Deoldify images #2

A deoldified Golden Gate Bridge under construction.

Neural Networks

Lecture Outline

  • Artificial Intelligence

  • Deep Learning Successes (Images)

  • Deep Learning Successes (Text)

  • Classifying Machine Learning Tasks

  • Neural Networks

  • California House Price Prediction

  • Our First Neural Network

  • Force positive predictions

  • Preprocessing

  • Early Stopping

How do real neurons work?

A neuron ‘firing’

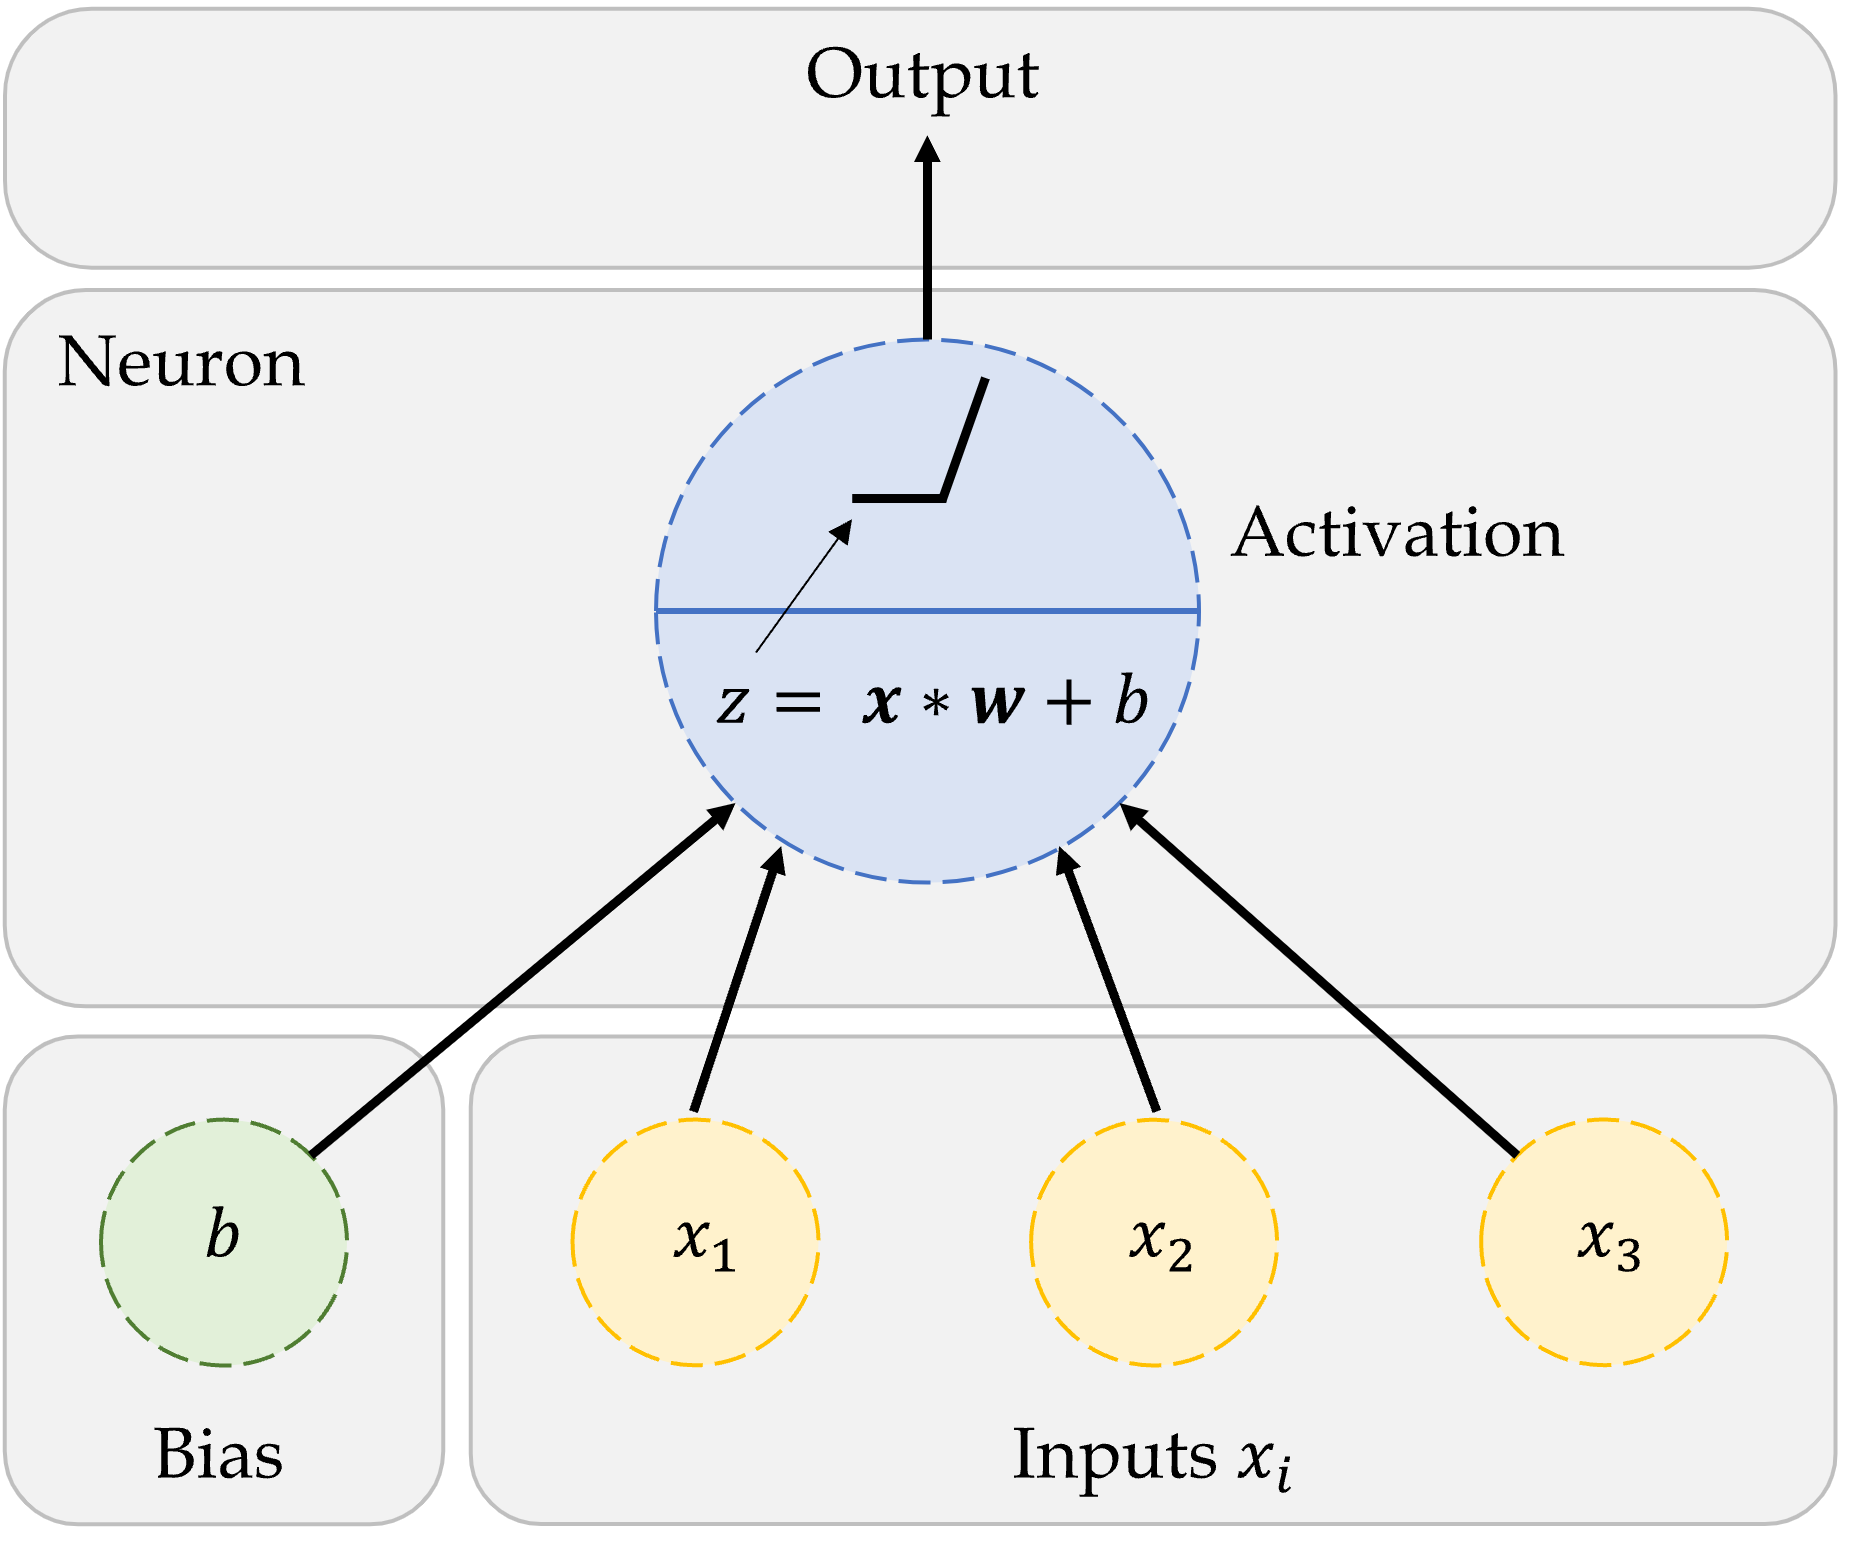
An artificial neuron

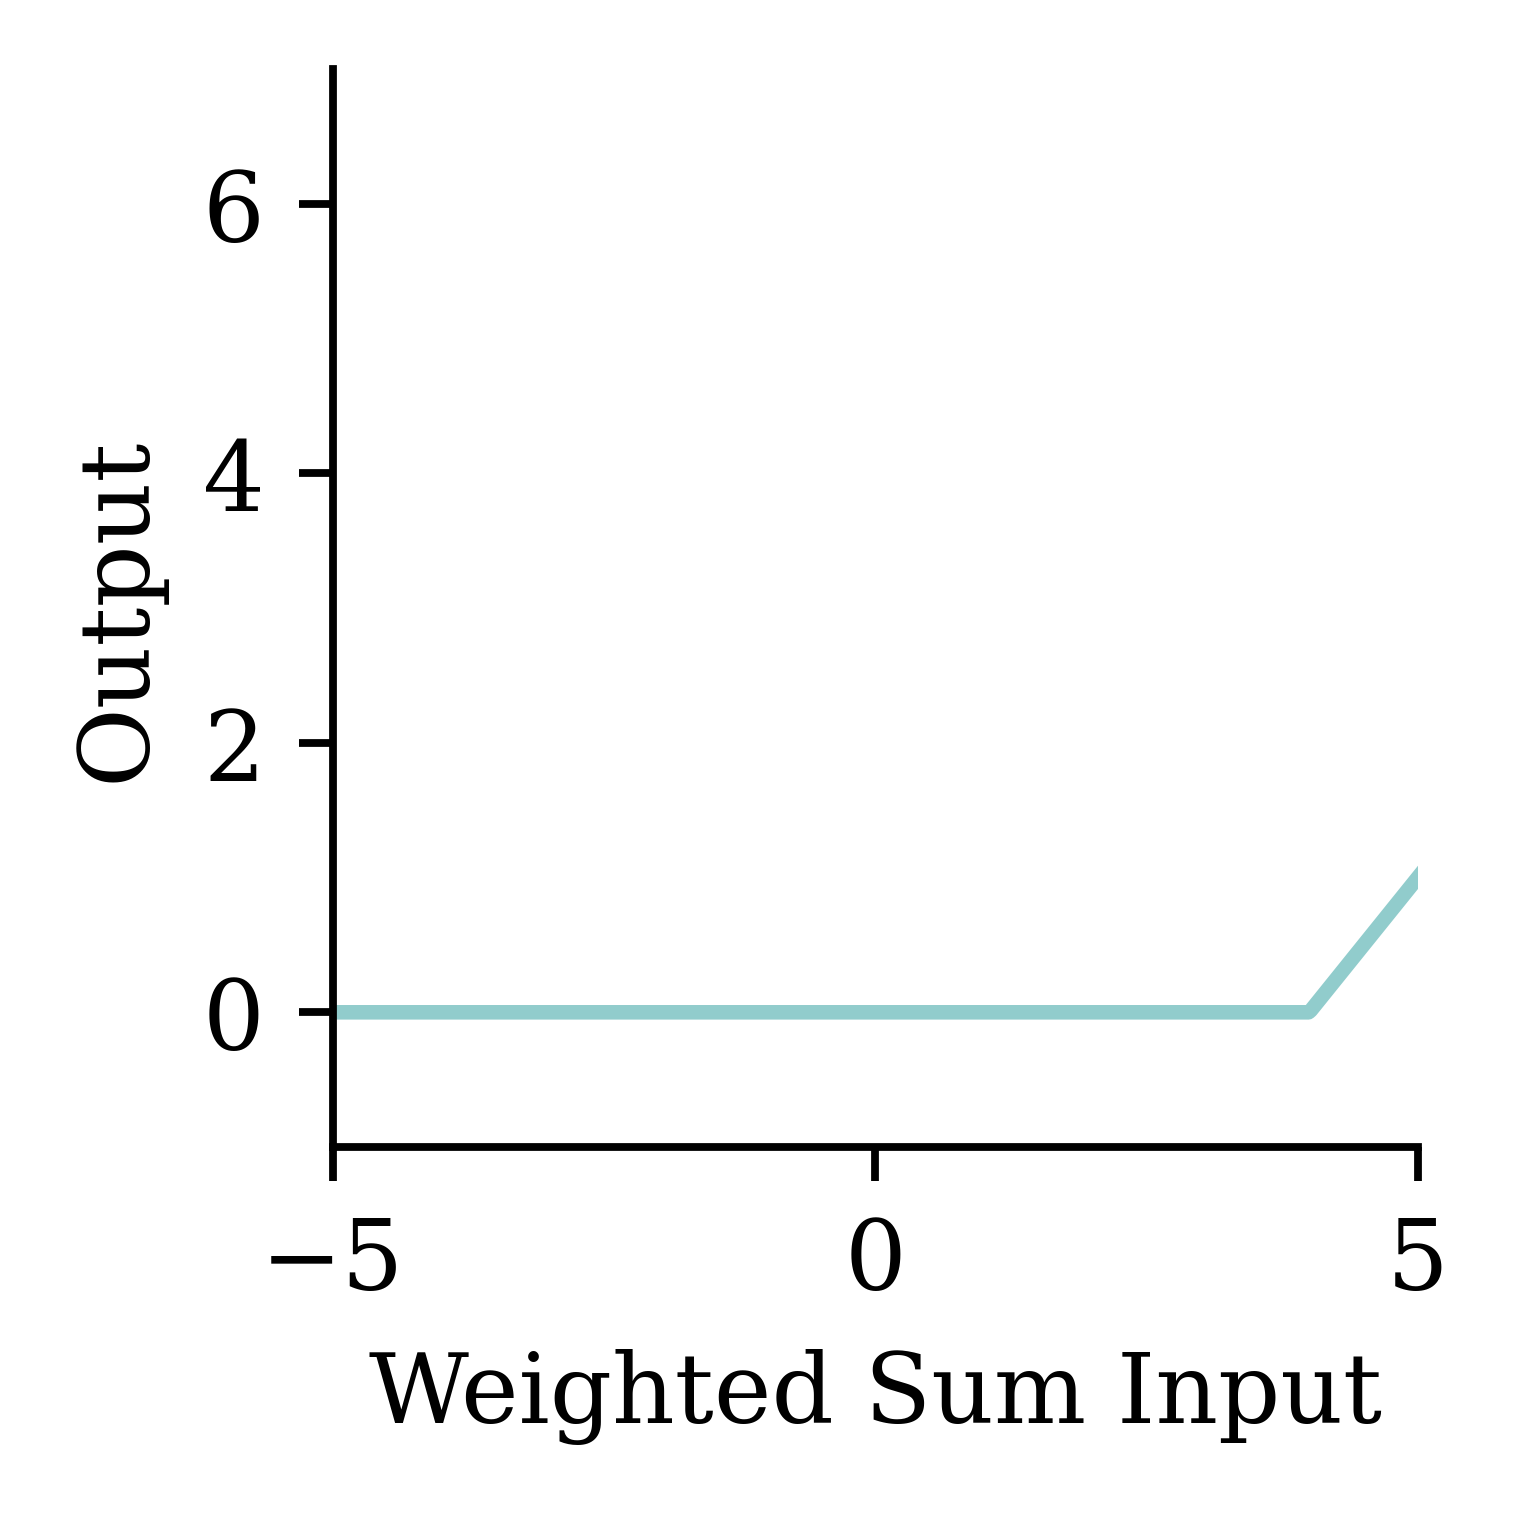
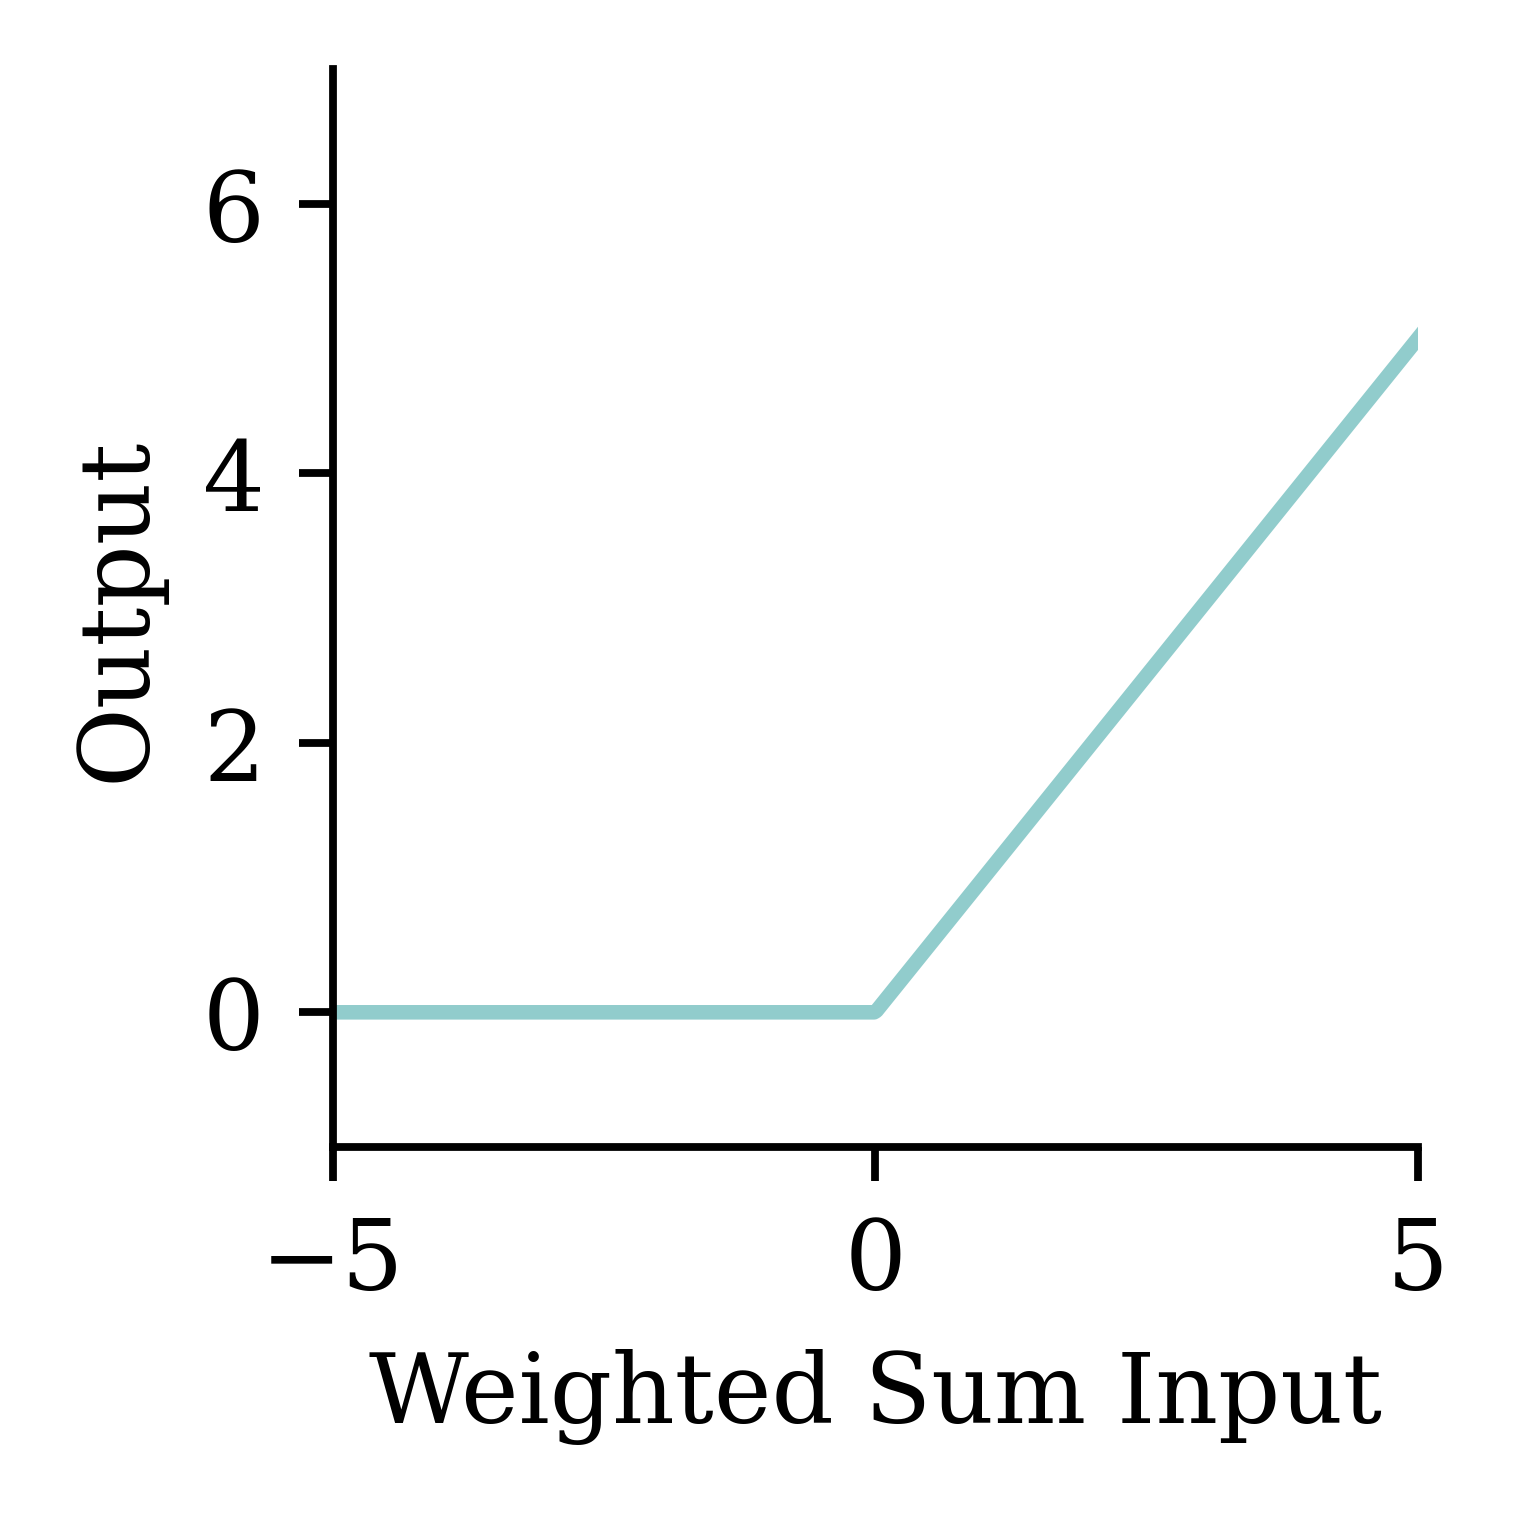
A neuron in a neural network with a ReLU activation.

One neuron

\begin{aligned} z~=~&x_1 \times w_1 + \\ &x_2 \times w_2 + \\ &x_3 \times w_3 . \end{aligned}

a = \begin{cases} z & \text{if } z > 0 \\ 0 & \text{if } z \leq 0 \end{cases}

Here, x_1, x_2, x_3 are just some fixed data.

A neuron in a neural network with a ReLU activation.

The weights w_1, w_2, w_3 should be ‘learned’.

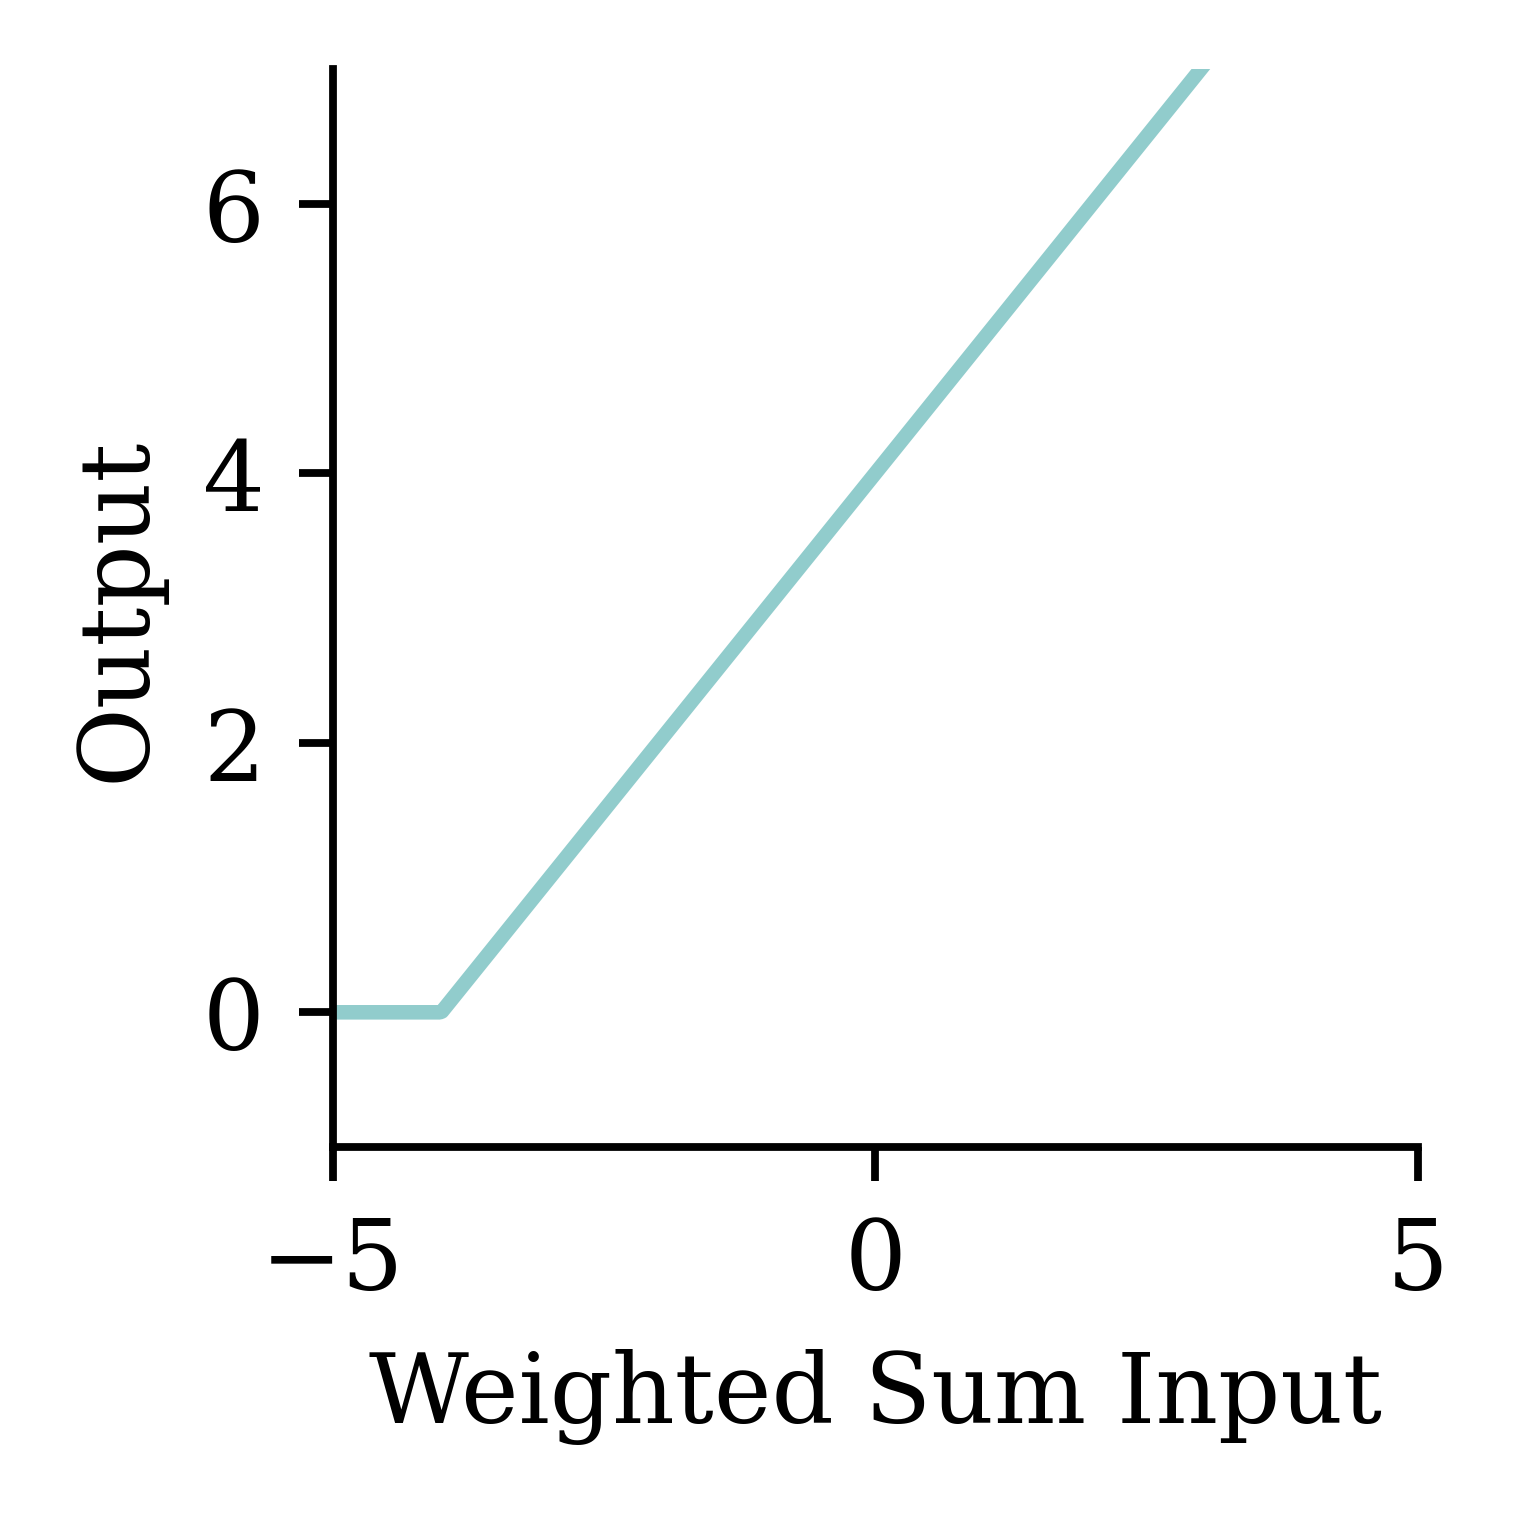
One neuron with bias
\begin{aligned} z~=~&x_1 \times w_1 + \\ &x_2 \times w_2 + \\ &x_3 \times w_3 + b . \end{aligned}

a = \begin{cases} z & \text{if } z > 0 \\ 0 & \text{if } z \leq 0 \end{cases}

The weights w_1, w_2, w_3 and bias b should be ‘learned’.

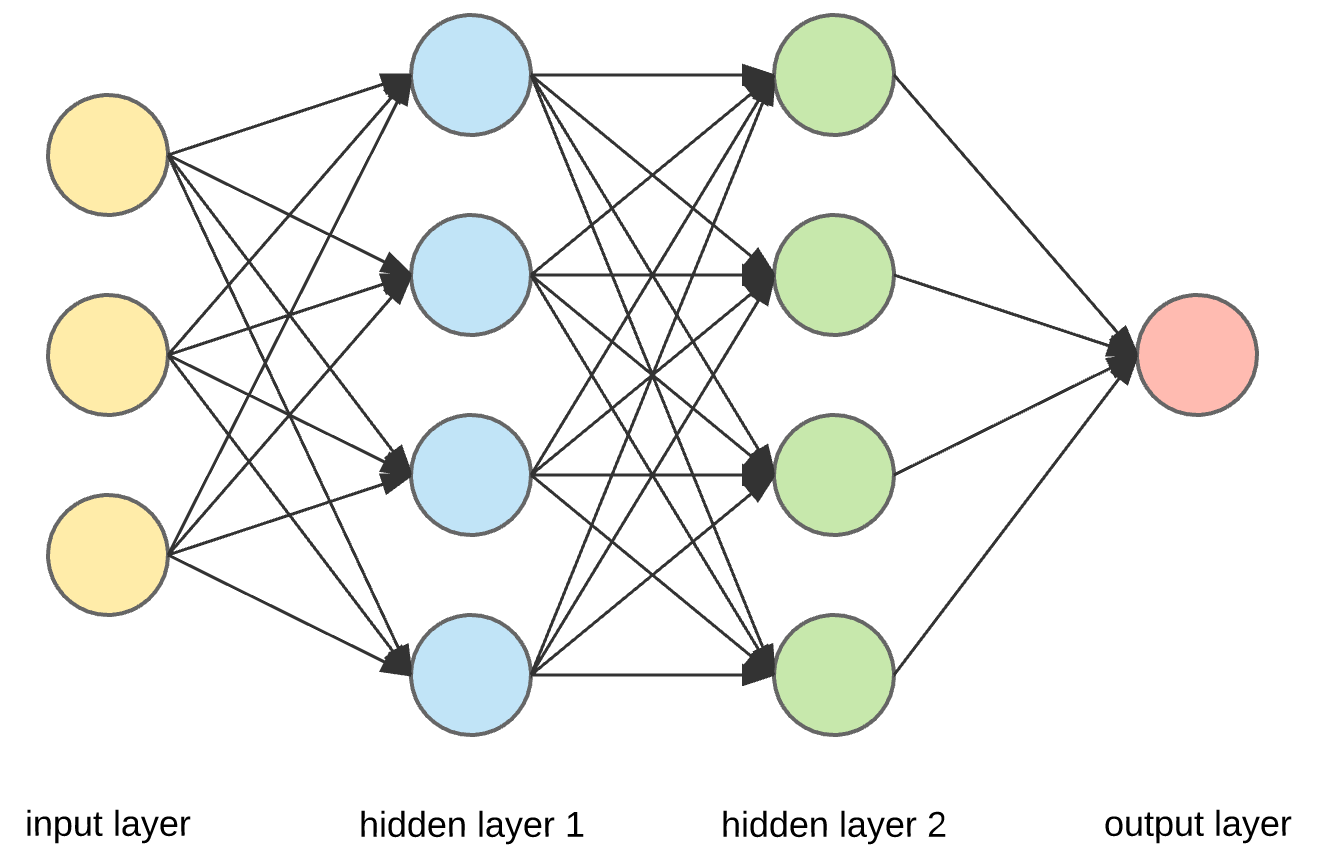
A basic neural network

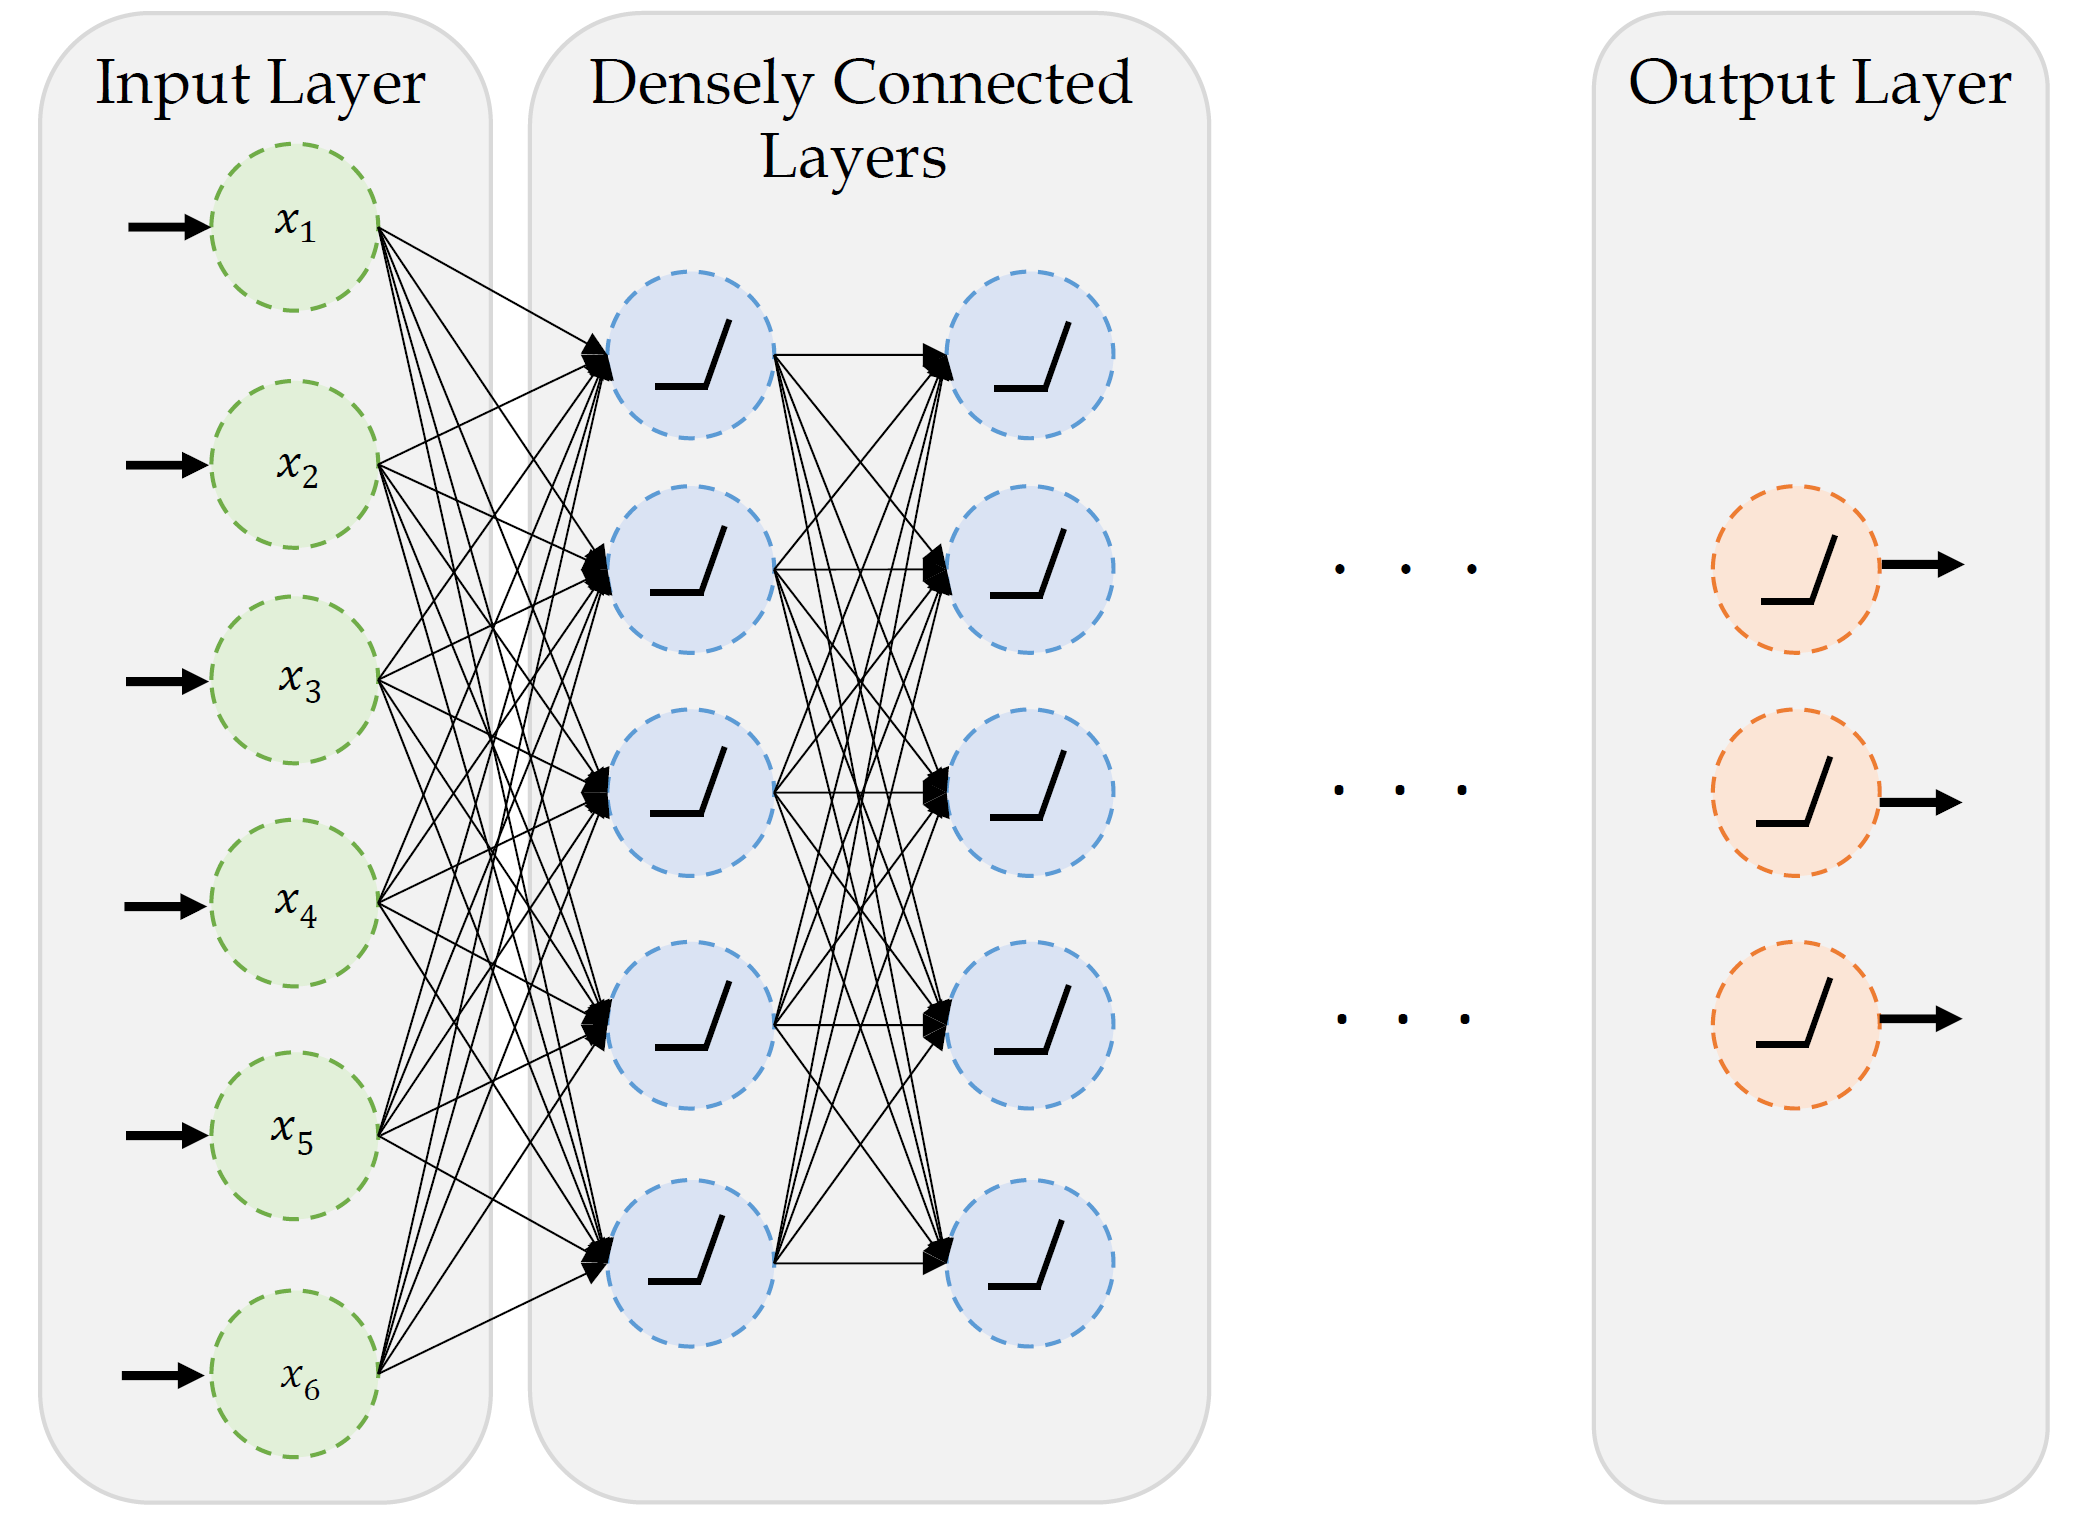
A basic fully-connected/dense network.

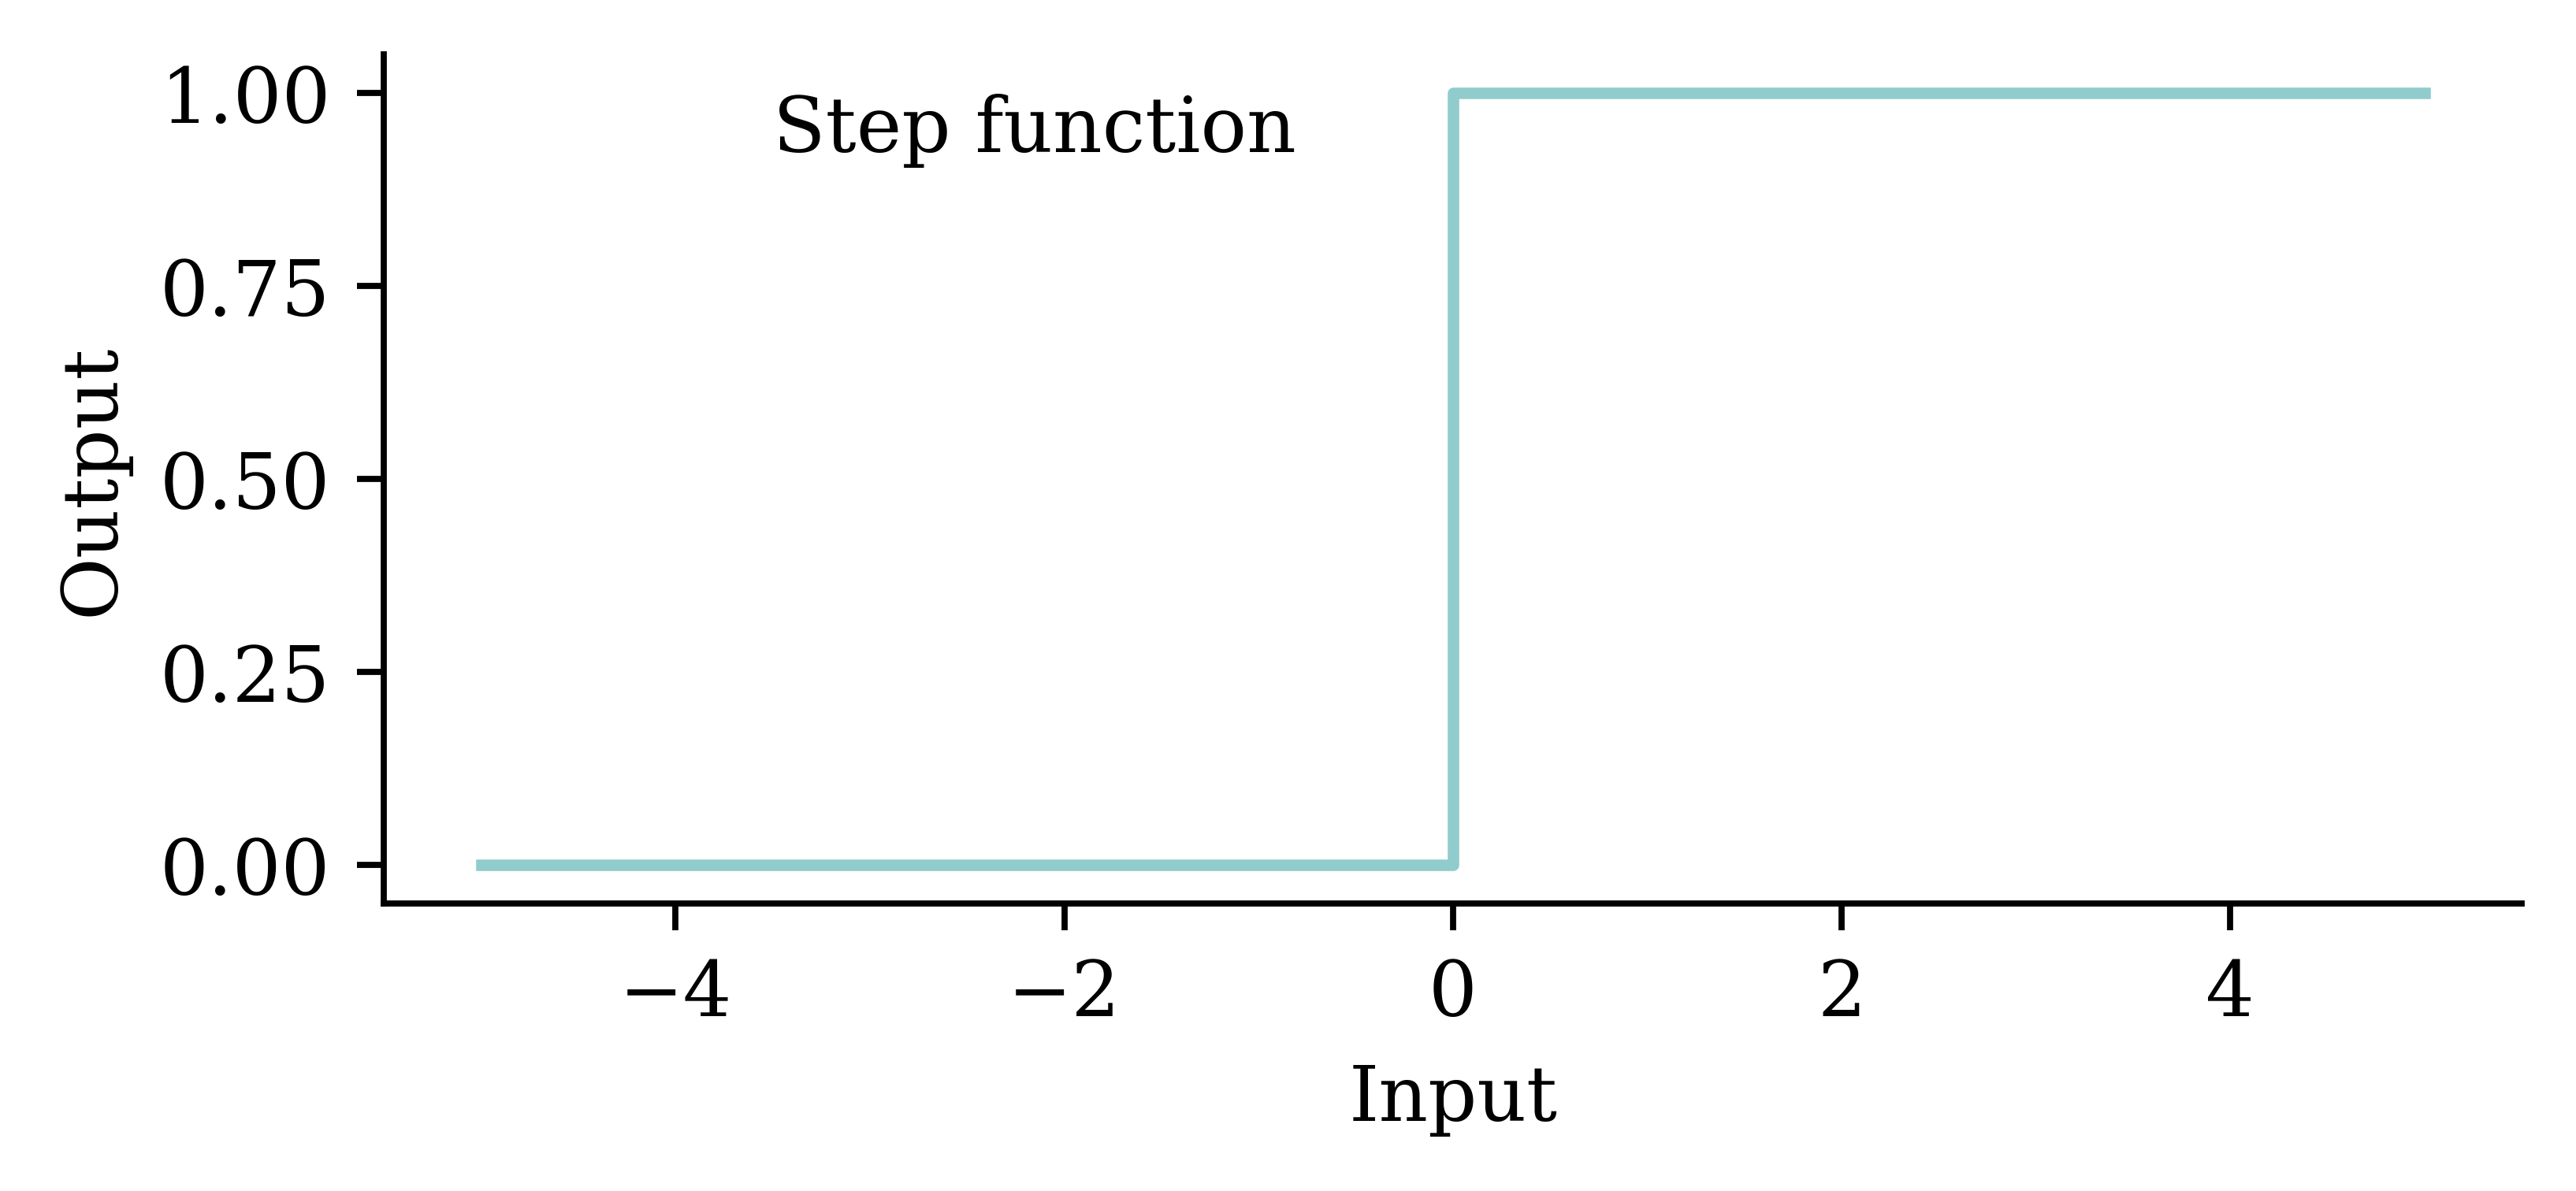
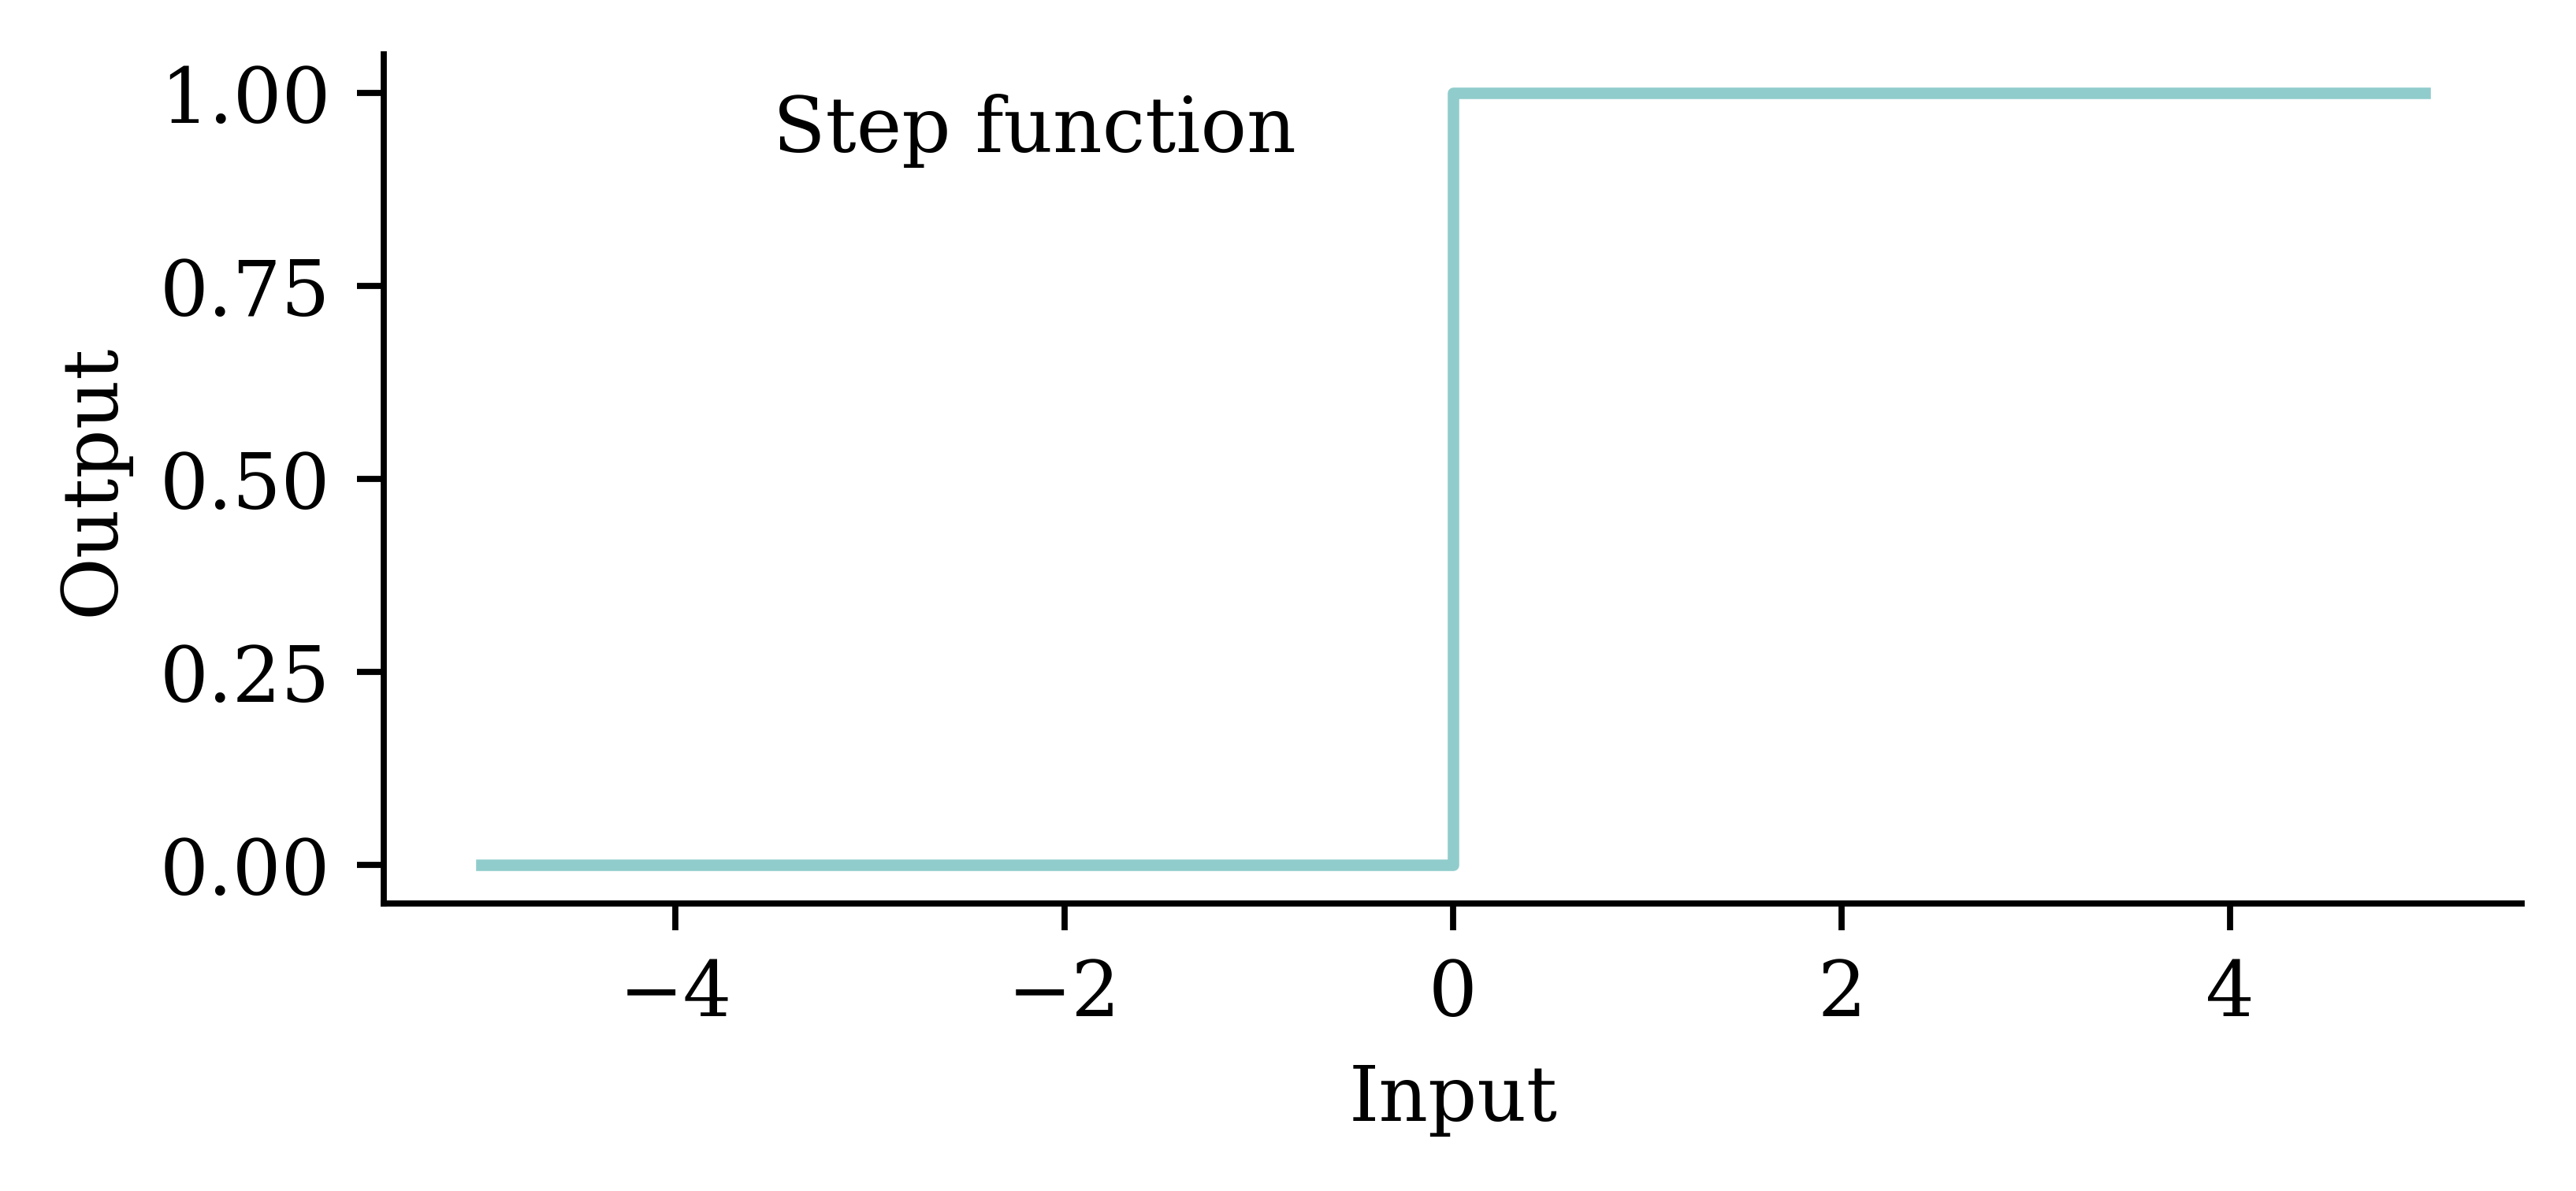
Step-function activation

Perceptrons

Brains and computers are binary, so make a perceptron with binary data. Seemed reasonable, impossible to train.

Modern neural network

Replace binary state with continuous state. Still rather slow to train.

Note

It’s a neural network made of neurons, not a “neuron network”.

Try different activation functions

Flexible

One can show that an MLP is a universal approximator, meaning it can model any suitably smooth function, given enough hidden units, to any desired level of accuracy (Hornik 1991). One can either make the model be “wide” or “deep”; the latter has some advantages…

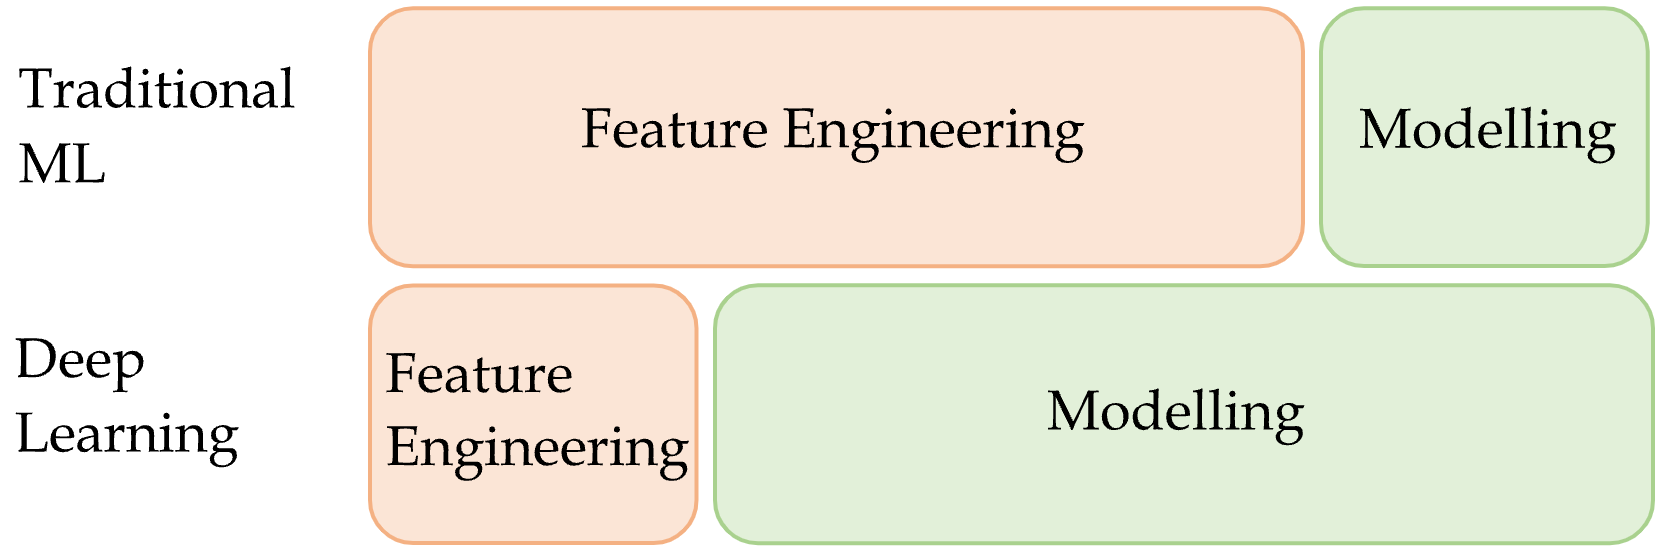
Feature engineering

Doesn’t mean deep learning is always the best option!

Quiz

In this ANN, how many of the following are there:

  • features,
  • targets,
  • weights,
  • biases, and
  • parameters?

What is the depth?

An artificial neural network.

California House Price Prediction

Lecture Outline

  • Artificial Intelligence

  • Deep Learning Successes (Images)

  • Deep Learning Successes (Text)

  • Classifying Machine Learning Tasks

  • Neural Networks

  • California House Price Prediction

  • Our First Neural Network

  • Force positive predictions

  • Preprocessing

  • Early Stopping

Imports needed for this demo

import random
from pathlib import Path

import numpy as np

from sklearn.datasets import fetch_california_housing
from sklearn.model_selection import train_test_split

from sklearn.linear_model import LinearRegression
from sklearn.metrics import mean_squared_error
from sklearn.preprocessing import StandardScaler, MinMaxScaler

from keras.models import Sequential
from keras.layers import Dense, Input

from keras.callbacks import EarlyStopping
from keras.callbacks import ModelCheckpoint

Data science always starts with the data!

The target variable is the median house value for California districts, expressed in $100,000’s. This dataset was derived from the 1990 U.S. census, using one row per census block group. A block group is the smallest geographical unit for which the U.S. Census Bureau publishes sample data (a block group typically has a population of 600 to 3,000 people).

Dall-E’s rendition of this dataset.

Columns

  • MedInc median income in block group
  • HouseAge median house age in block group
  • AveRooms average number of rooms per household
  • AveBedrms average # of bedrooms per household
  • Population block group population
  • AveOccup average number of household members
  • Latitude block group latitude
  • Longitude block group longitude
  • MedHouseVal median house value (target)

Import the data

features, target = fetch_california_housing(as_frame=True, return_X_y=True)
features
MedInc HouseAge AveRooms AveBedrms Population AveOccup Latitude Longitude
0 8.3252 41.0 6.984127 1.023810 322.0 2.555556 37.88 -122.23
1 8.3014 21.0 6.238137 0.971880 2401.0 2.109842 37.86 -122.22
2 7.2574 52.0 8.288136 1.073446 496.0 2.802260 37.85 -122.24
... ... ... ... ... ... ... ... ...
20637 1.7000 17.0 5.205543 1.120092 1007.0 2.325635 39.43 -121.22
20638 1.8672 18.0 5.329513 1.171920 741.0 2.123209 39.43 -121.32
20639 2.3886 16.0 5.254717 1.162264 1387.0 2.616981 39.37 -121.24

20640 rows × 8 columns

Train/validation/test split

X_main, X_test, y_main, y_test = train_test_split(
    features, target, test_size=0.2, random_state=1)
X_train, X_val, y_train, y_val = train_test_split(
    X_main, y_main, test_size=0.25, random_state=1)

num_features = features.shape[1]
print(X_train.shape, X_val.shape, X_test.shape)
(12384, 8) (4128, 8) (4128, 8)

Linear regression baseline

Refit the linear regression from earlier; we’ll compare neural networks against this baseline.

lr = LinearRegression()
lr.fit(X_train, y_train)

mse_lr_train = mean_squared_error(y_train, lr.predict(X_train))
mse_lr_val = mean_squared_error(y_val, lr.predict(X_val))

mse_train = {"Linear Regression": mse_lr_train}
mse_val = {"Linear Regression": mse_lr_val}

Our First Neural Network

Lecture Outline

  • Artificial Intelligence

  • Deep Learning Successes (Images)

  • Deep Learning Successes (Text)

  • Classifying Machine Learning Tasks

  • Neural Networks

  • California House Price Prediction

  • Our First Neural Network

  • Force positive predictions

  • Preprocessing

  • Early Stopping

What are Keras and PyTorch?

Keras is a common way of specifying, training, and using neural networks. It gives a simple interface to various backend libraries, including PyTorch.
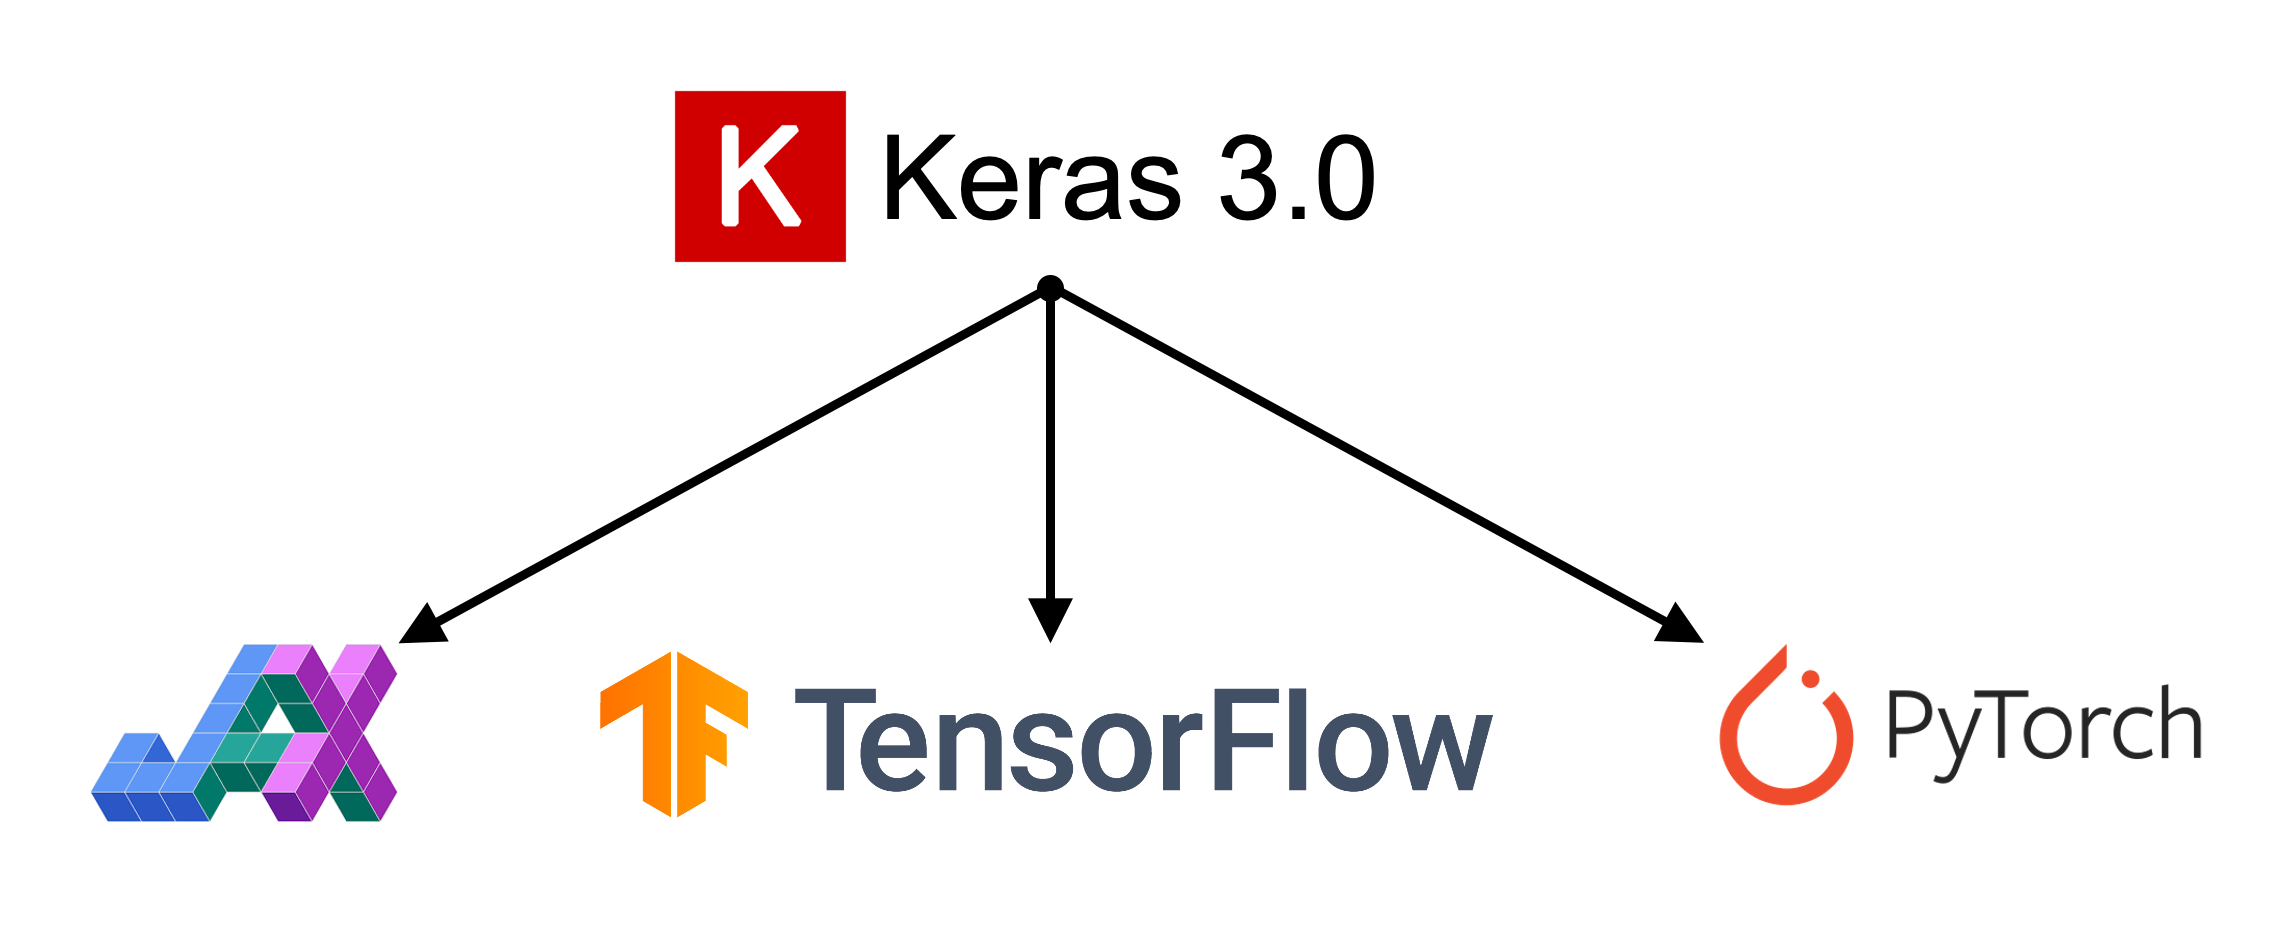
The Keras application programming interface (API)

Create a Keras ANN model

Decide on the architecture: a simple fully-connected network with one hidden layer with 30 neurons.

Create the model:

model = Sequential(
    [Input((num_features,)),
     Dense(30, activation="leaky_relu"), 
     Dense(1, activation="leaky_relu")]
)

Inspect the model

model.summary()
Model: "sequential"
┏━━━━━━━━━━━━━━━━━━━━━━━━━━━━━━━━━┳━━━━━━━━━━━━━━━━━━━━━━━━┳━━━━━━━━━━━━━━━┓
┃ Layer (type)                     Output Shape                  Param # ┃
┡━━━━━━━━━━━━━━━━━━━━━━━━━━━━━━━━━╇━━━━━━━━━━━━━━━━━━━━━━━━╇━━━━━━━━━━━━━━━┩
│ dense (Dense)                   │ (None, 30)             │           270 │
├─────────────────────────────────┼────────────────────────┼───────────────┤
│ dense_1 (Dense)                 │ (None, 1)              │            31 │
└─────────────────────────────────┴────────────────────────┴───────────────┘
 Total params: 301 (1.18 KB)
 Trainable params: 301 (1.18 KB)
 Non-trainable params: 0 (0.00 B)

The model is initialised randomly

model = Sequential([Dense(30, activation="leaky_relu"), Dense(1, activation="leaky_relu")])
model.predict(X_val.head(3), verbose=0)
array([[-139.05],
       [ -84.57],
       [  -5.82]], dtype=float32)
model = Sequential([Dense(30, activation="leaky_relu"), Dense(1, activation="leaky_relu")])
model.predict(X_val.head(3), verbose=0)
array([[-108.21],
       [ -64.74],
       [  -7.1 ]], dtype=float32)

Controlling the randomness

random.seed(123)

model = Sequential([Dense(30, activation="leaky_relu"), Dense(1, activation="leaky_relu")])

display(model.predict(X_val.head(3), verbose=0))

random.seed(123)
model = Sequential([Dense(30, activation="leaky_relu"), Dense(1, activation="leaky_relu")])

display(model.predict(X_val.head(3), verbose=0))
array([[-81.4 ],
       [-48.06],
       [ -2.77]], dtype=float32)
array([[-81.4 ],
       [-48.06],
       [ -2.77]], dtype=float32)

Fit the model

random.seed(123)

model = Sequential([
    Dense(30, activation="leaky_relu"),
    Dense(1, activation="leaky_relu")
])

model.compile("adam", "mse")
%time hist = model.fit(X_train, y_train, epochs=5, verbose=False)
hist.history["loss"]
CPU times: user 3.39 s, sys: 113 ms, total: 3.5 s
Wall time: 3.45 s
[63.02413558959961,
 3.4991047382354736,
 3.3900036811828613,
 2.1773459911346436,
 2.335667848587036]


Make predictions

y_pred = model.predict(X_train[:3], verbose=0)
y_pred
array([[ 0.29],
       [-0.91],
       [-0.17]], dtype=float32)

Note

The .predict gives us a ‘matrix’ not a ‘vector’. Calling .flatten() will convert it to a ‘vector’.

print(f"Original shape: {y_pred.shape}")
y_pred = y_pred.flatten()
print(f"Flattened shape: {y_pred.shape}")
y_pred
Original shape: (3, 1)
Flattened shape: (3,)
array([ 0.29, -0.91, -0.17], dtype=float32)

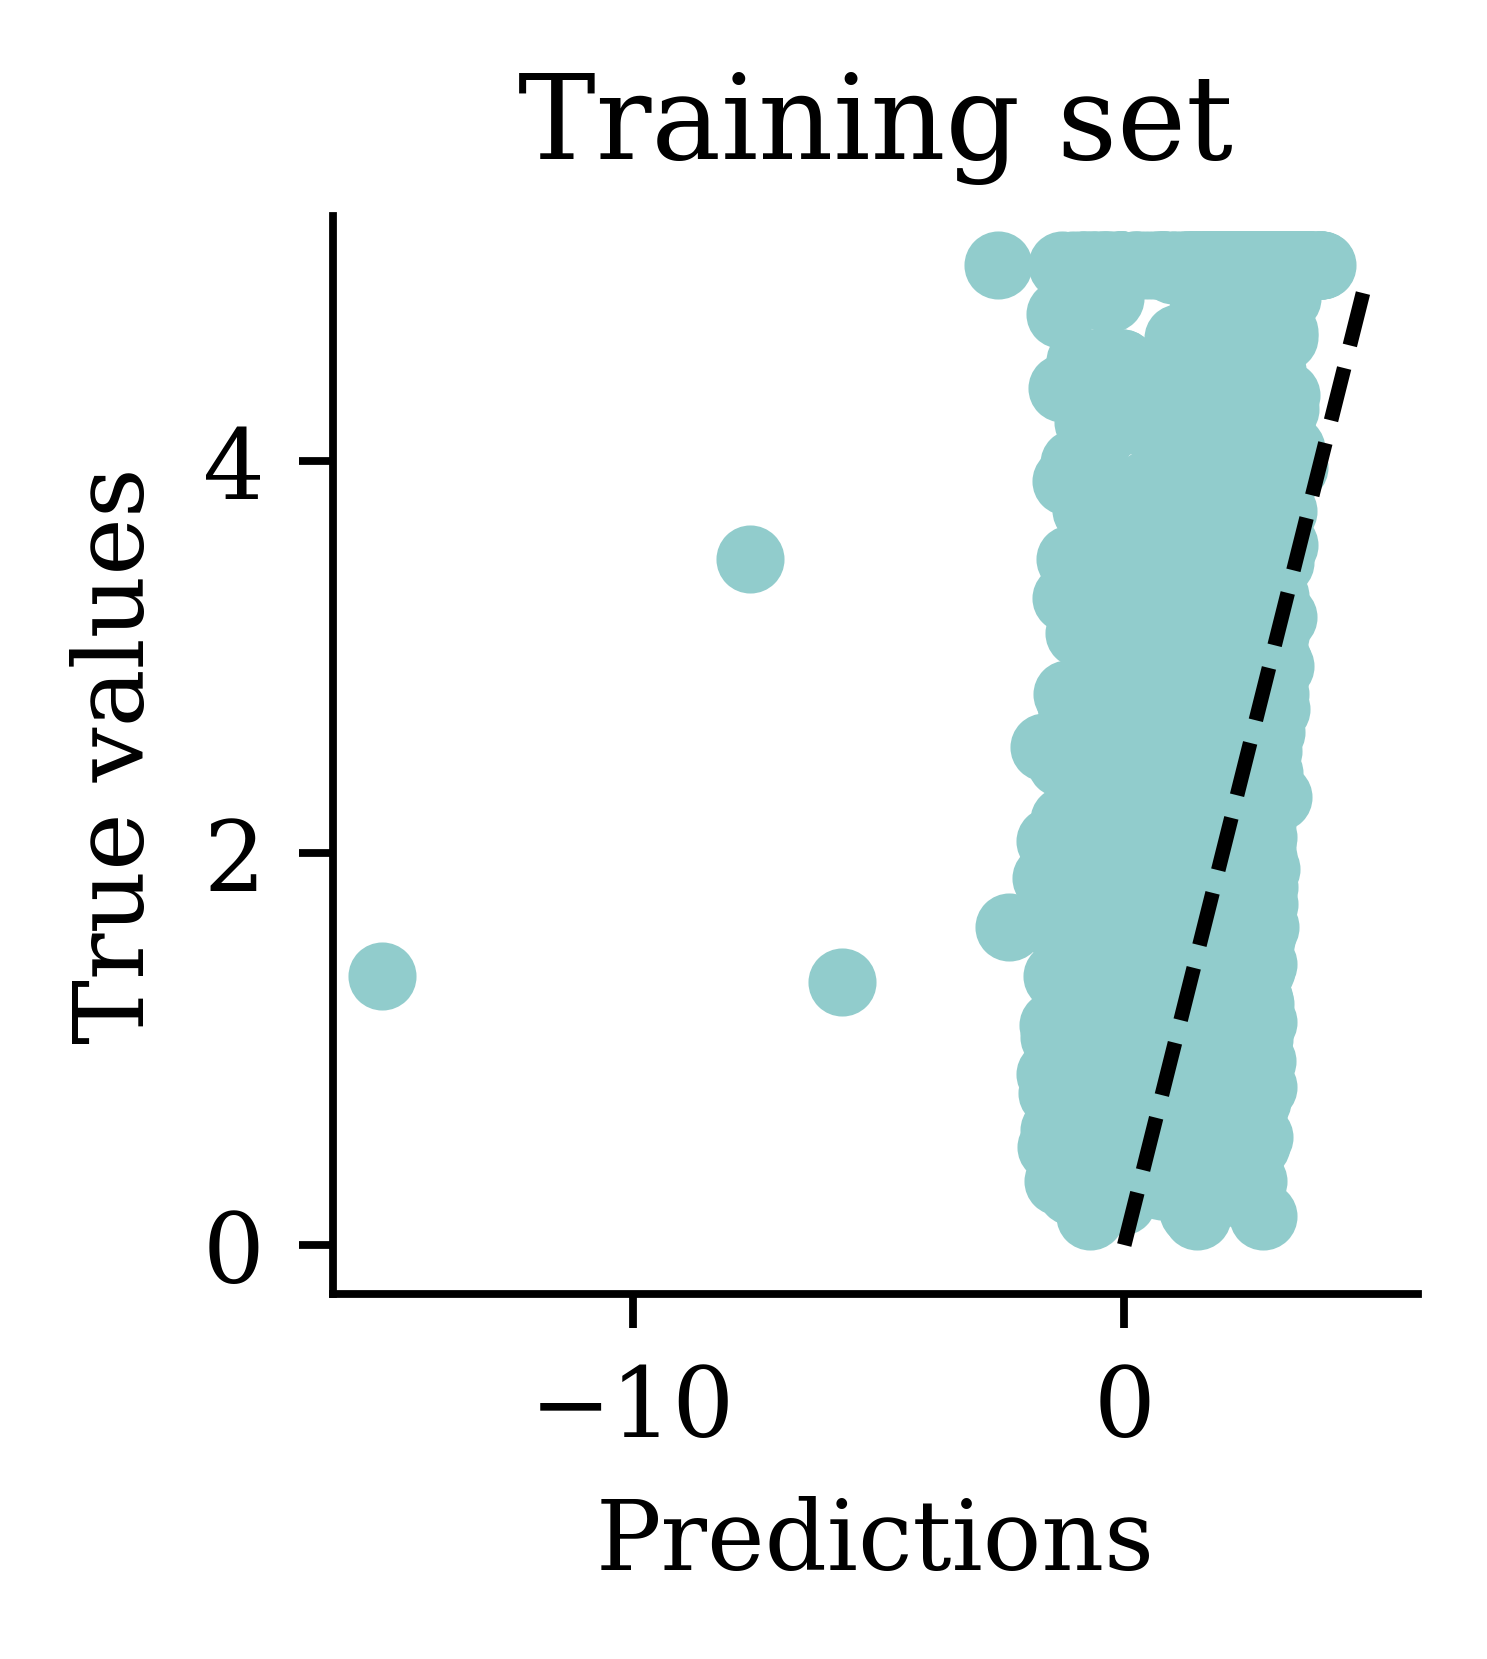
Plot the predictions

Assess the model

y_pred = model.predict(X_val, verbose=0)
mean_squared_error(y_val, y_pred)
2.845539574957286
mse_train["Basic ANN"] = mean_squared_error(
    y_train, model.predict(X_train, verbose=0)
)
mse_val["Basic ANN"] = mean_squared_error(y_val, model.predict(X_val, verbose=0))

Some predictions are negative:

y_pred = model.predict(X_val, verbose=0)
y_pred.min(), y_pred.max()
(np.float32(-4.7767005), np.float32(7.326745))
y_val.min(), y_val.max()
(np.float64(0.225), np.float64(5.00001))

Force positive predictions

Lecture Outline

  • Artificial Intelligence

  • Deep Learning Successes (Images)

  • Deep Learning Successes (Text)

  • Classifying Machine Learning Tasks

  • Neural Networks

  • California House Price Prediction

  • Our First Neural Network

  • Force positive predictions

  • Preprocessing

  • Early Stopping

Try running for longer

random.seed(123)

model = Sequential([
    Dense(30, activation="leaky_relu"),
    Dense(1, activation="leaky_relu")
])

model.compile("adam", "mse")

%time hist = model.fit(X_train, y_train, epochs=50, verbose=False)
CPU times: user 33.6 s, sys: 840 ms, total: 34.4 s
Wall time: 33.8 s

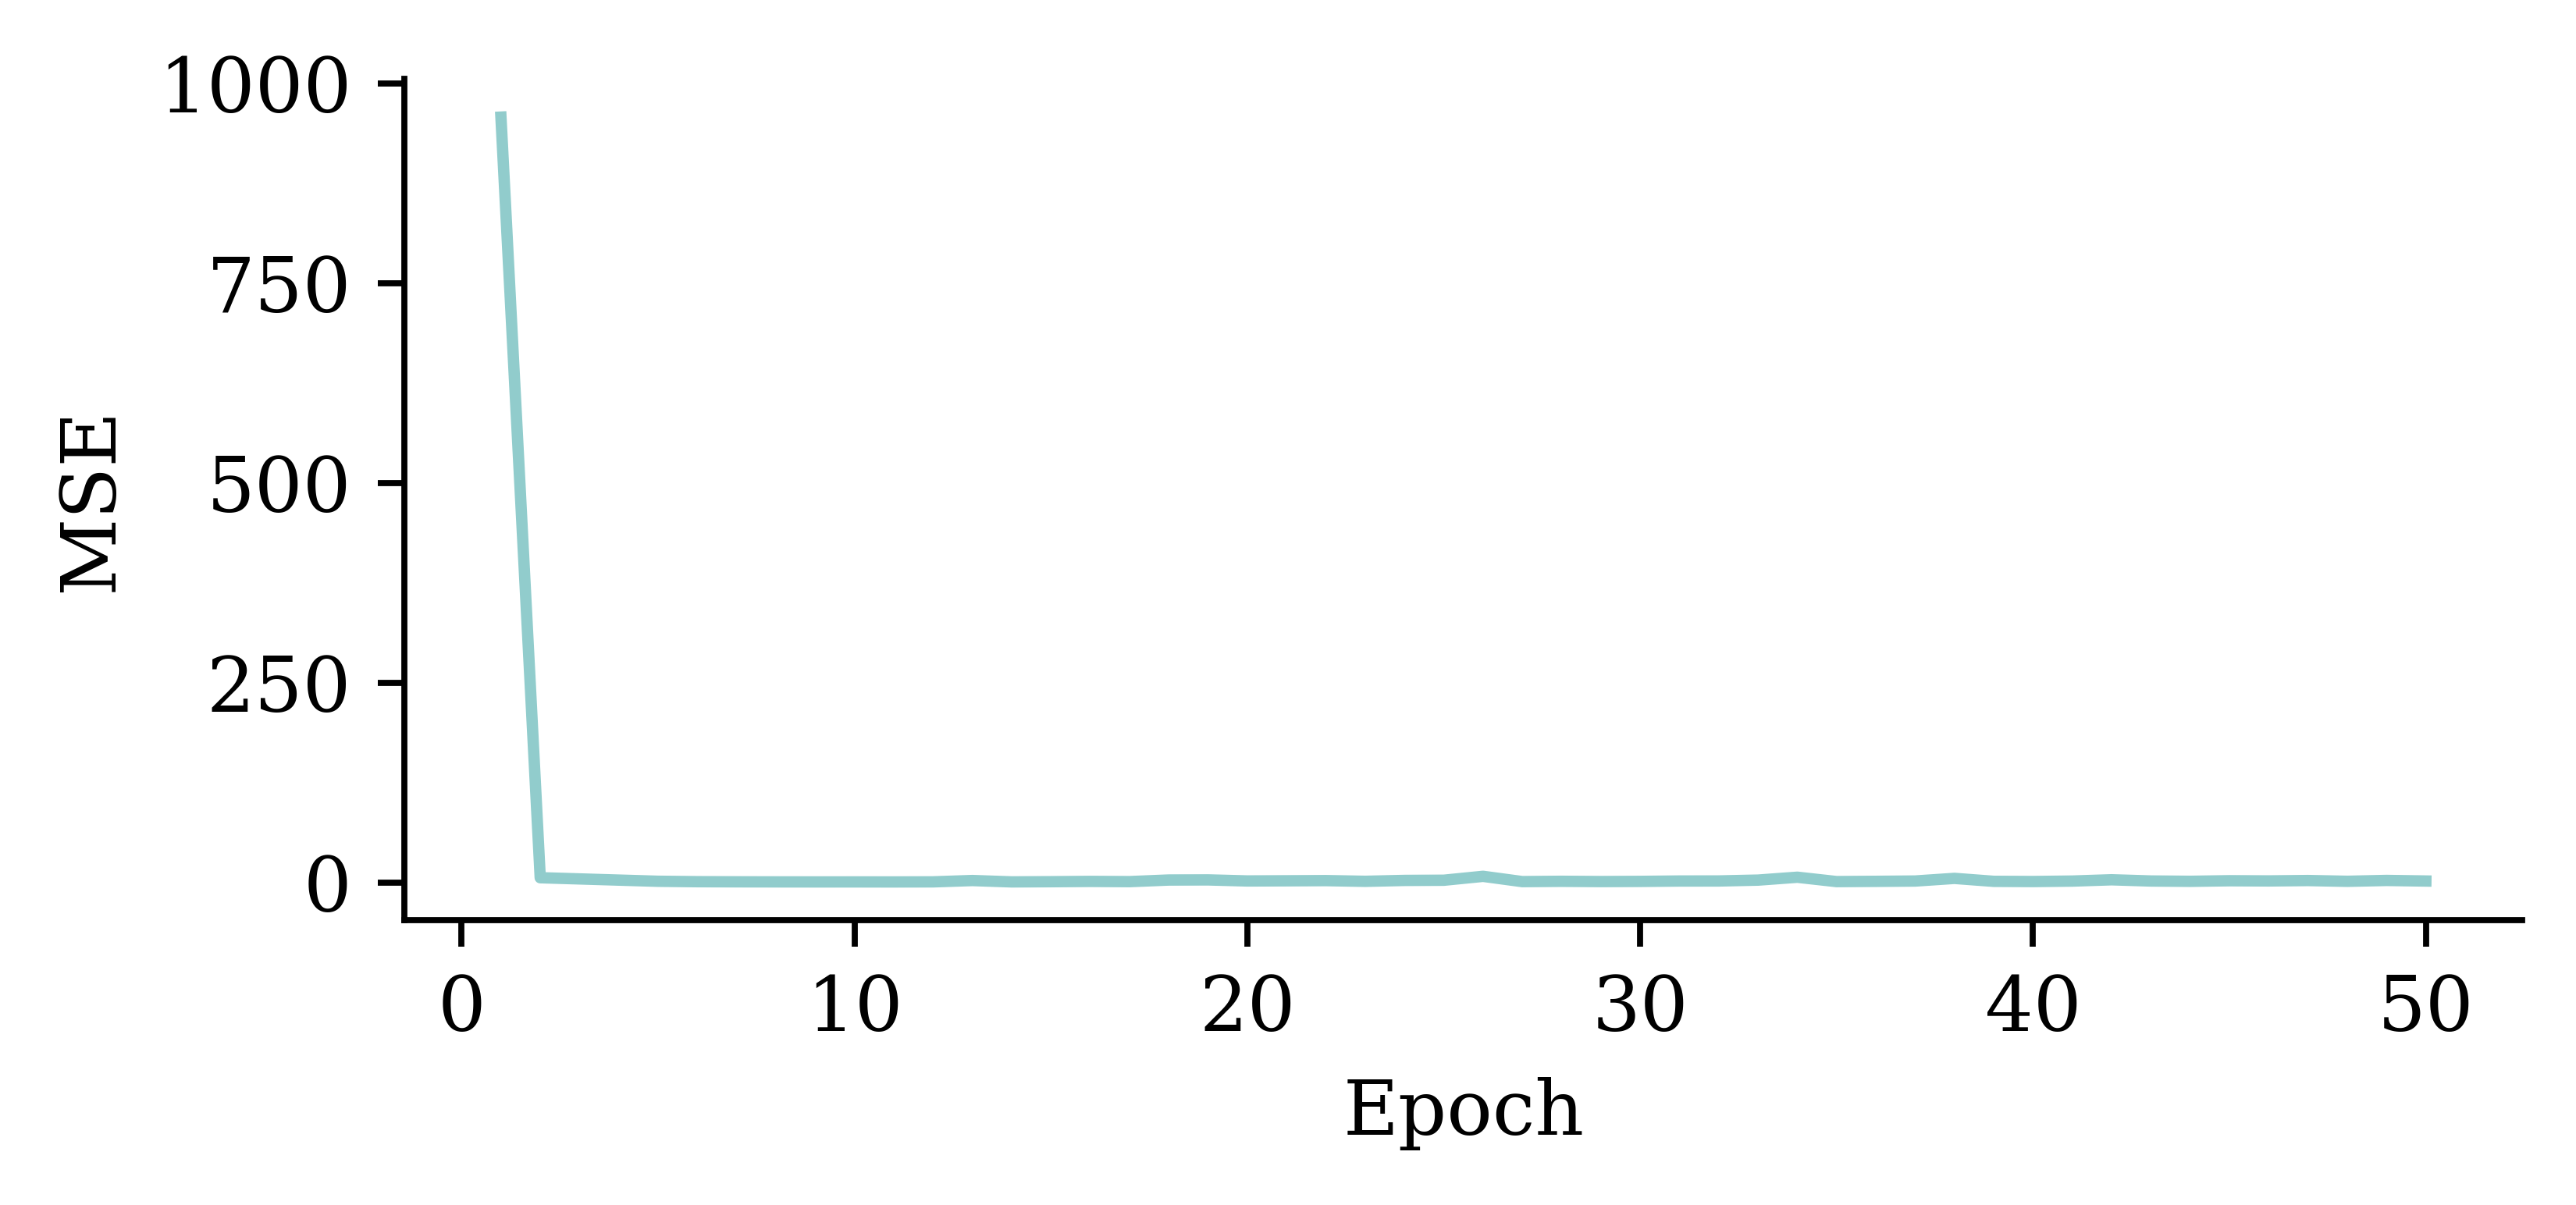
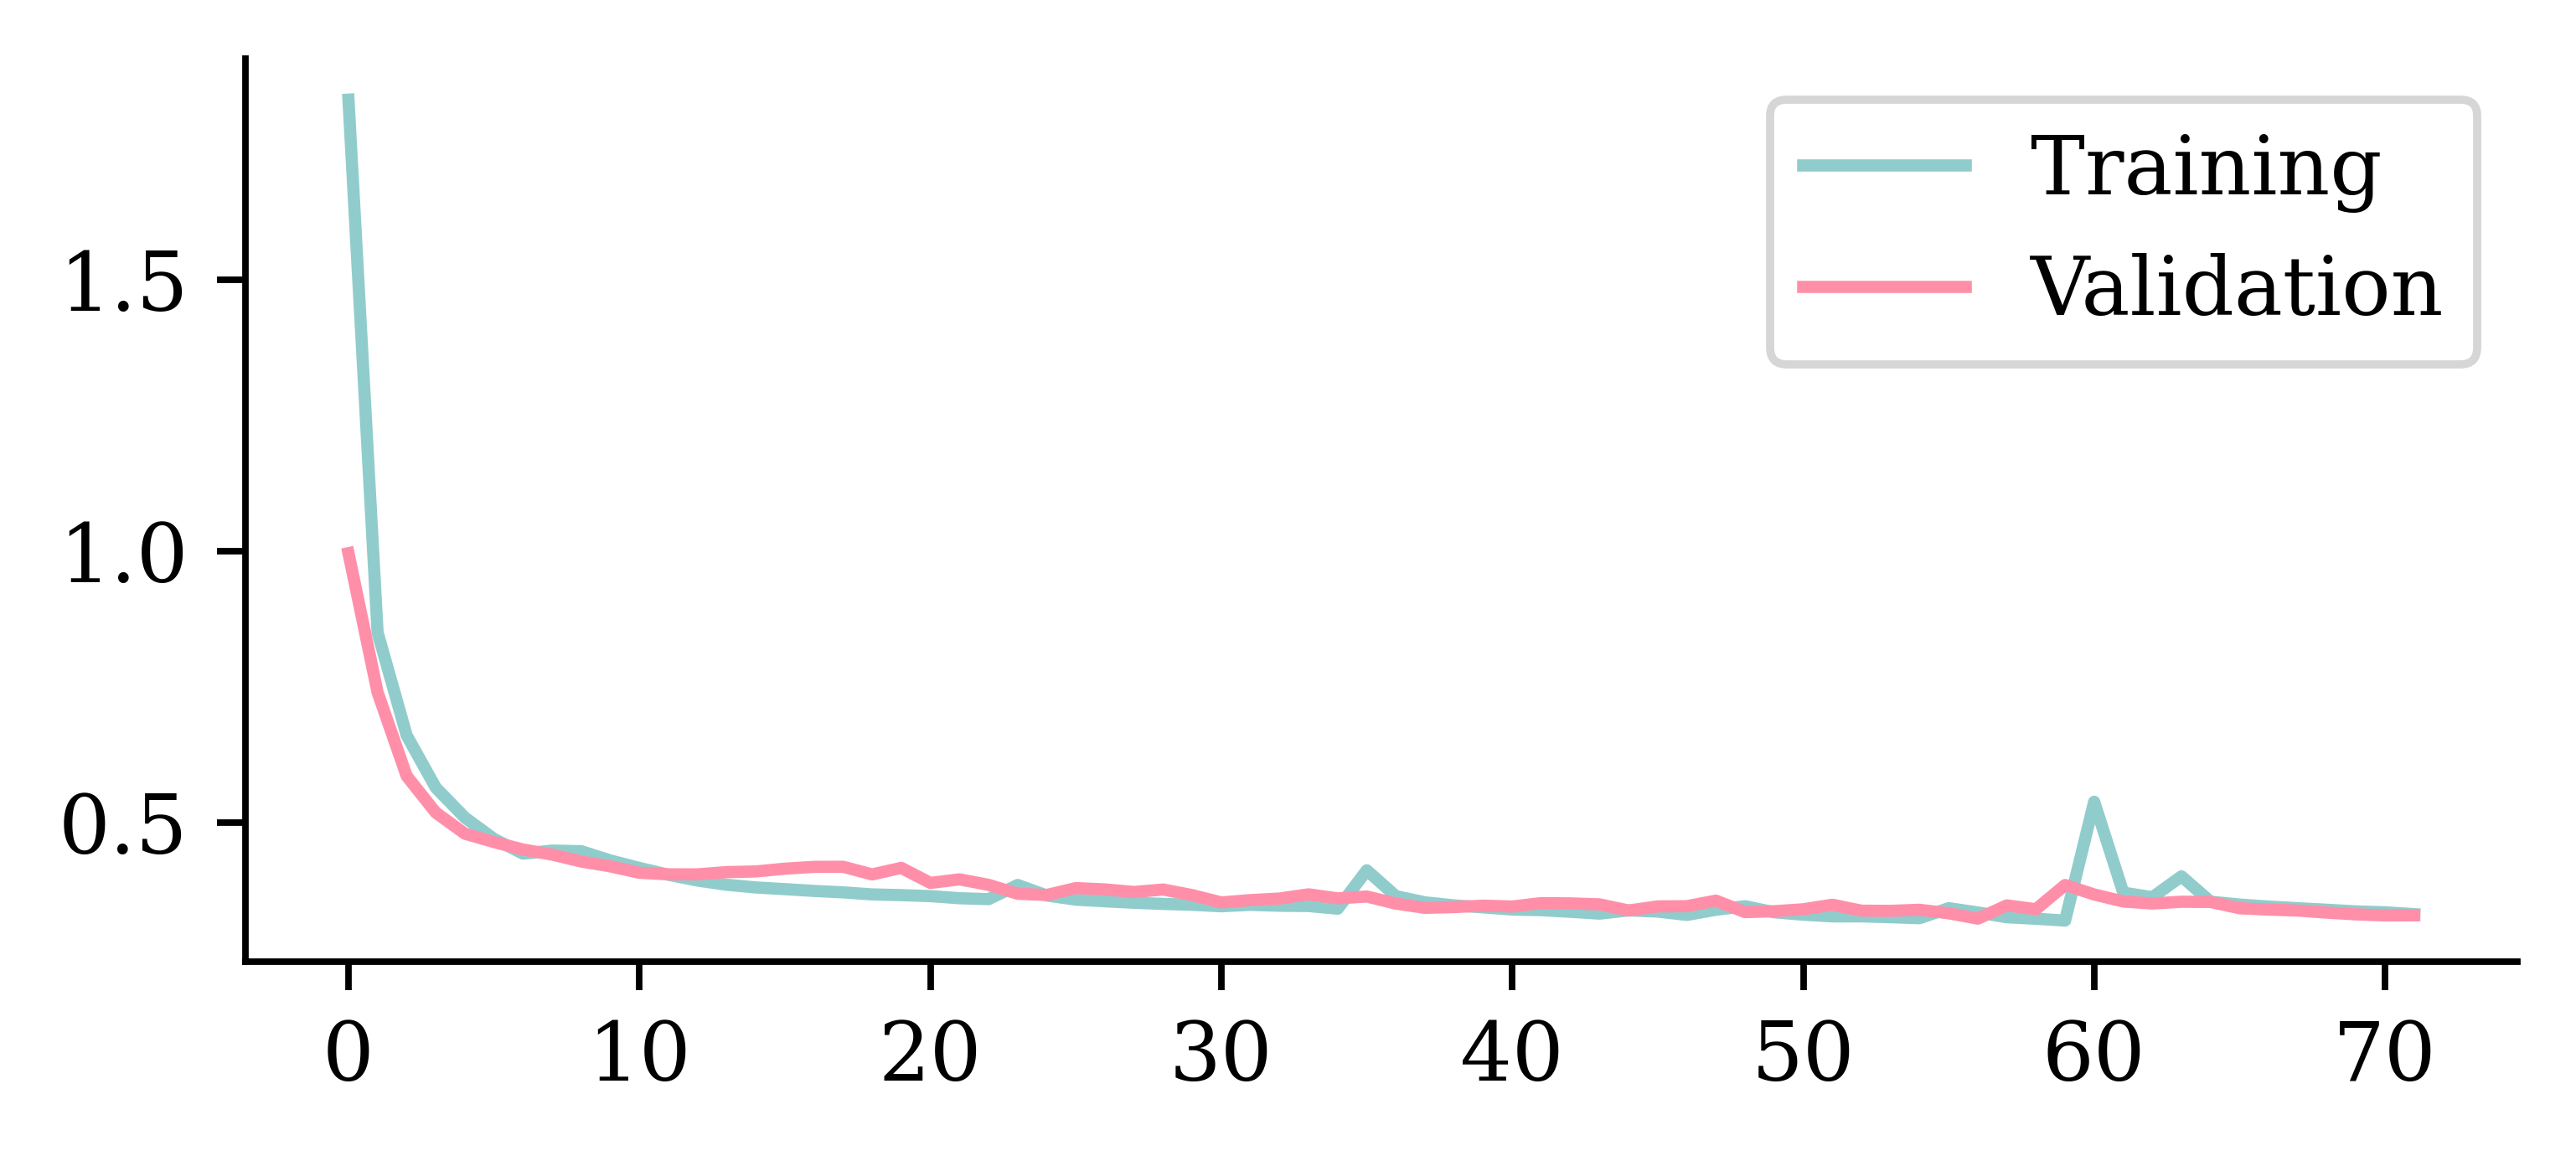
Loss curve

plt.plot(range(1, 51), hist.history["loss"])
plt.xlabel("Epoch")
plt.ylabel("MSE");

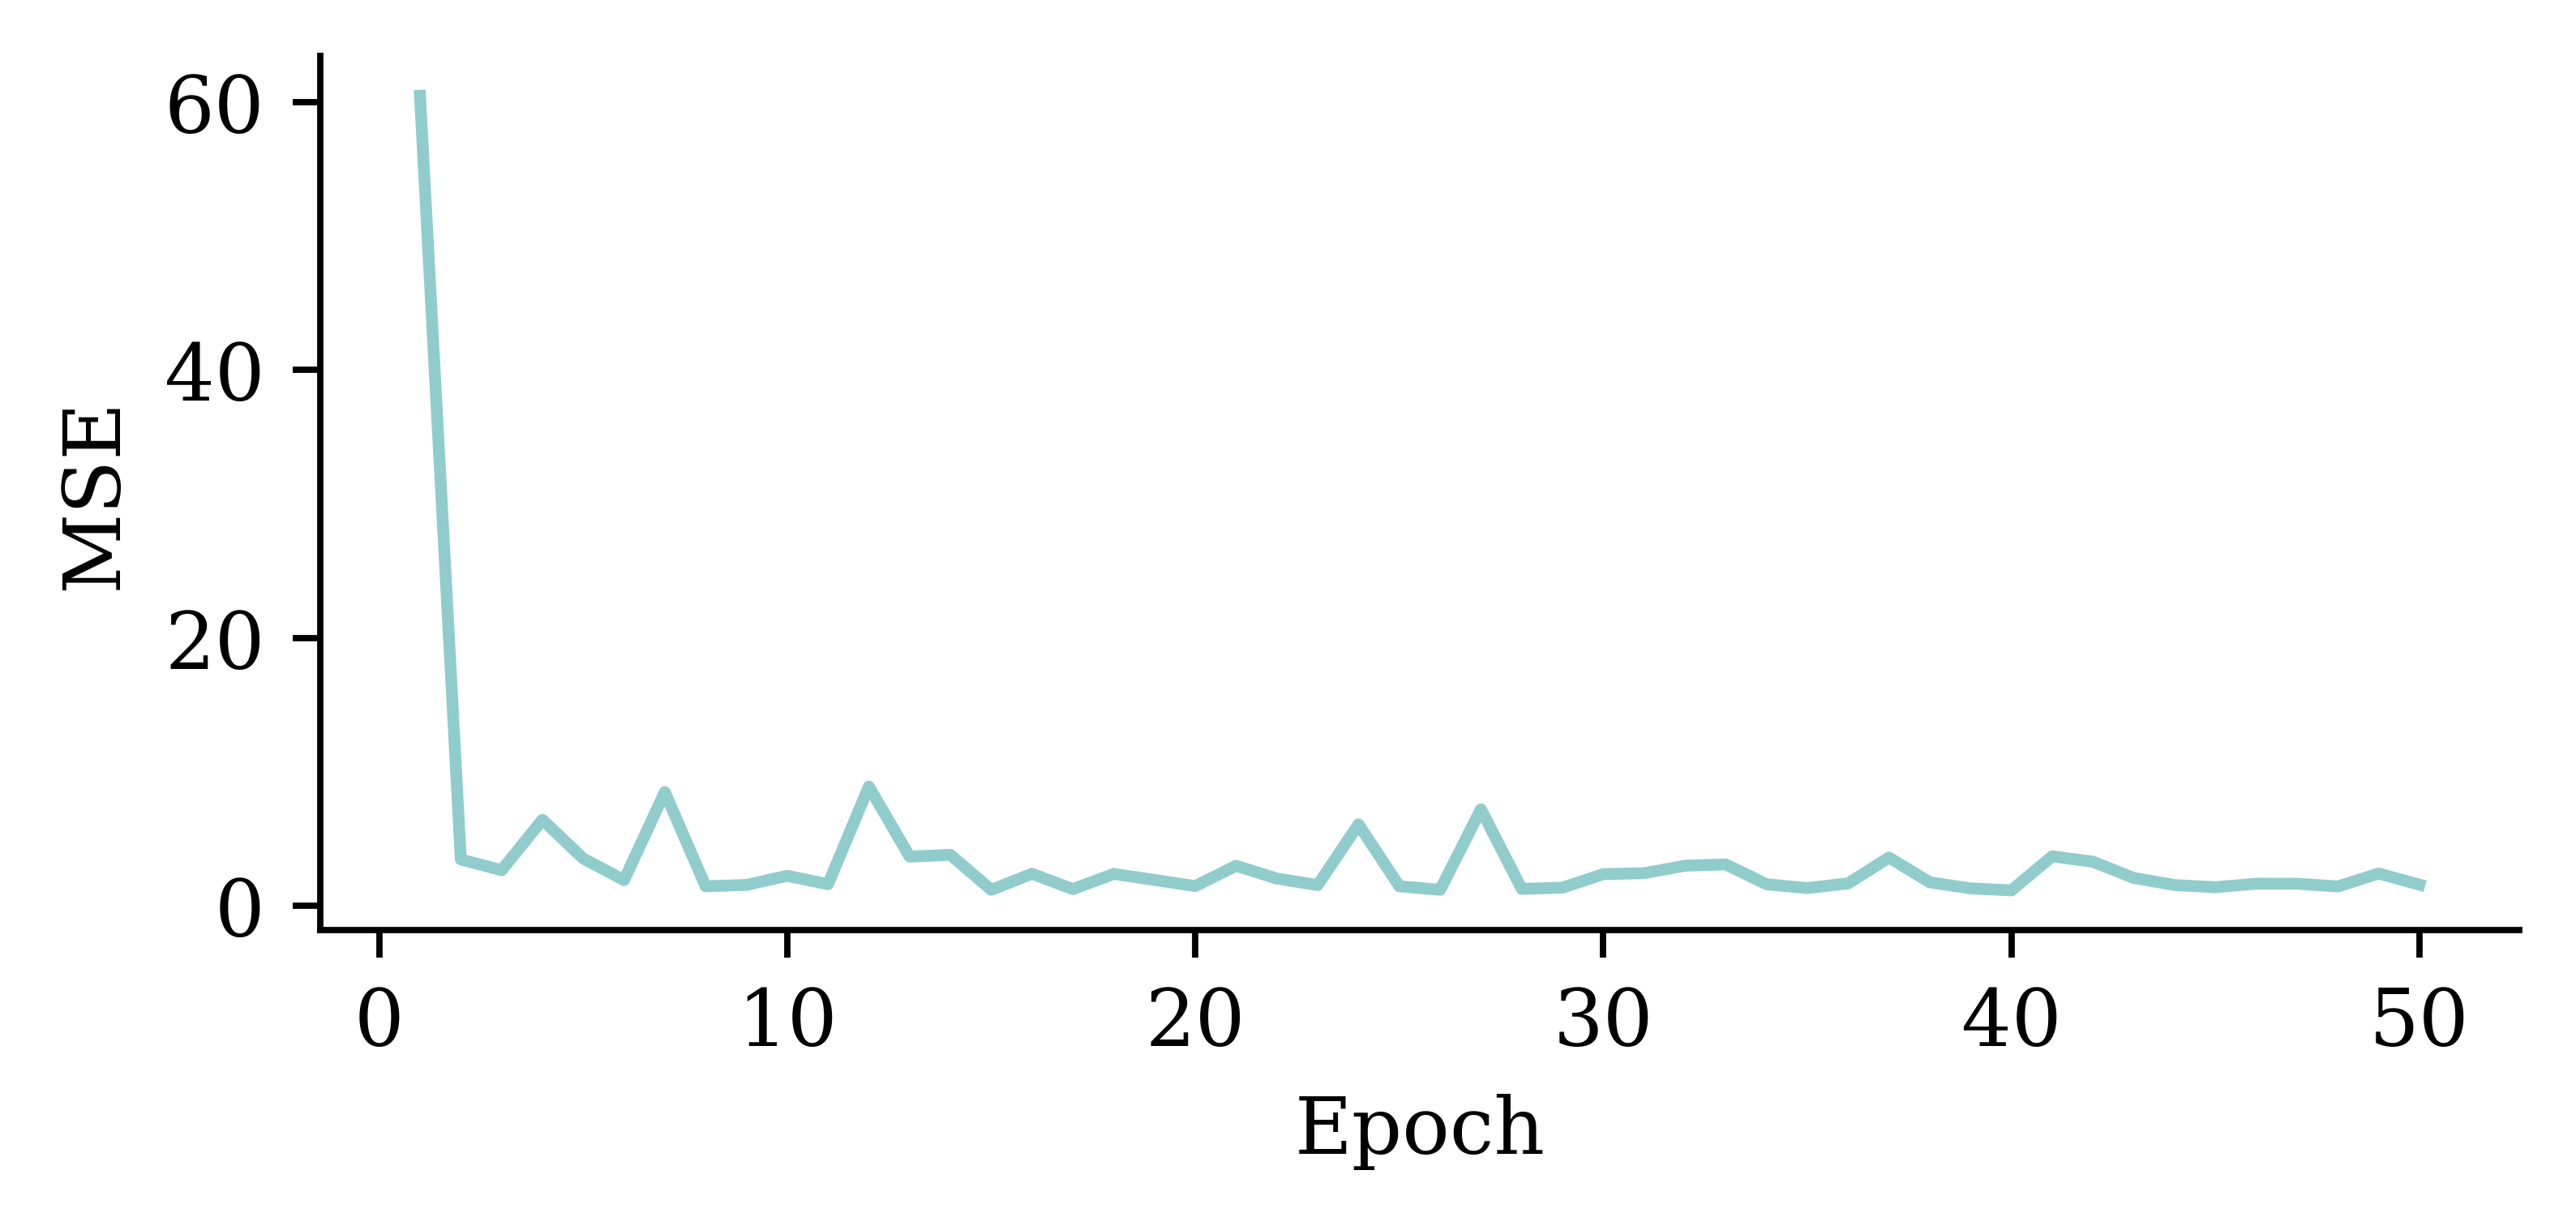
Loss curve

plt.plot(range(2, 51), hist.history["loss"][1:])
plt.xlabel("Epoch")
plt.ylabel("MSE");

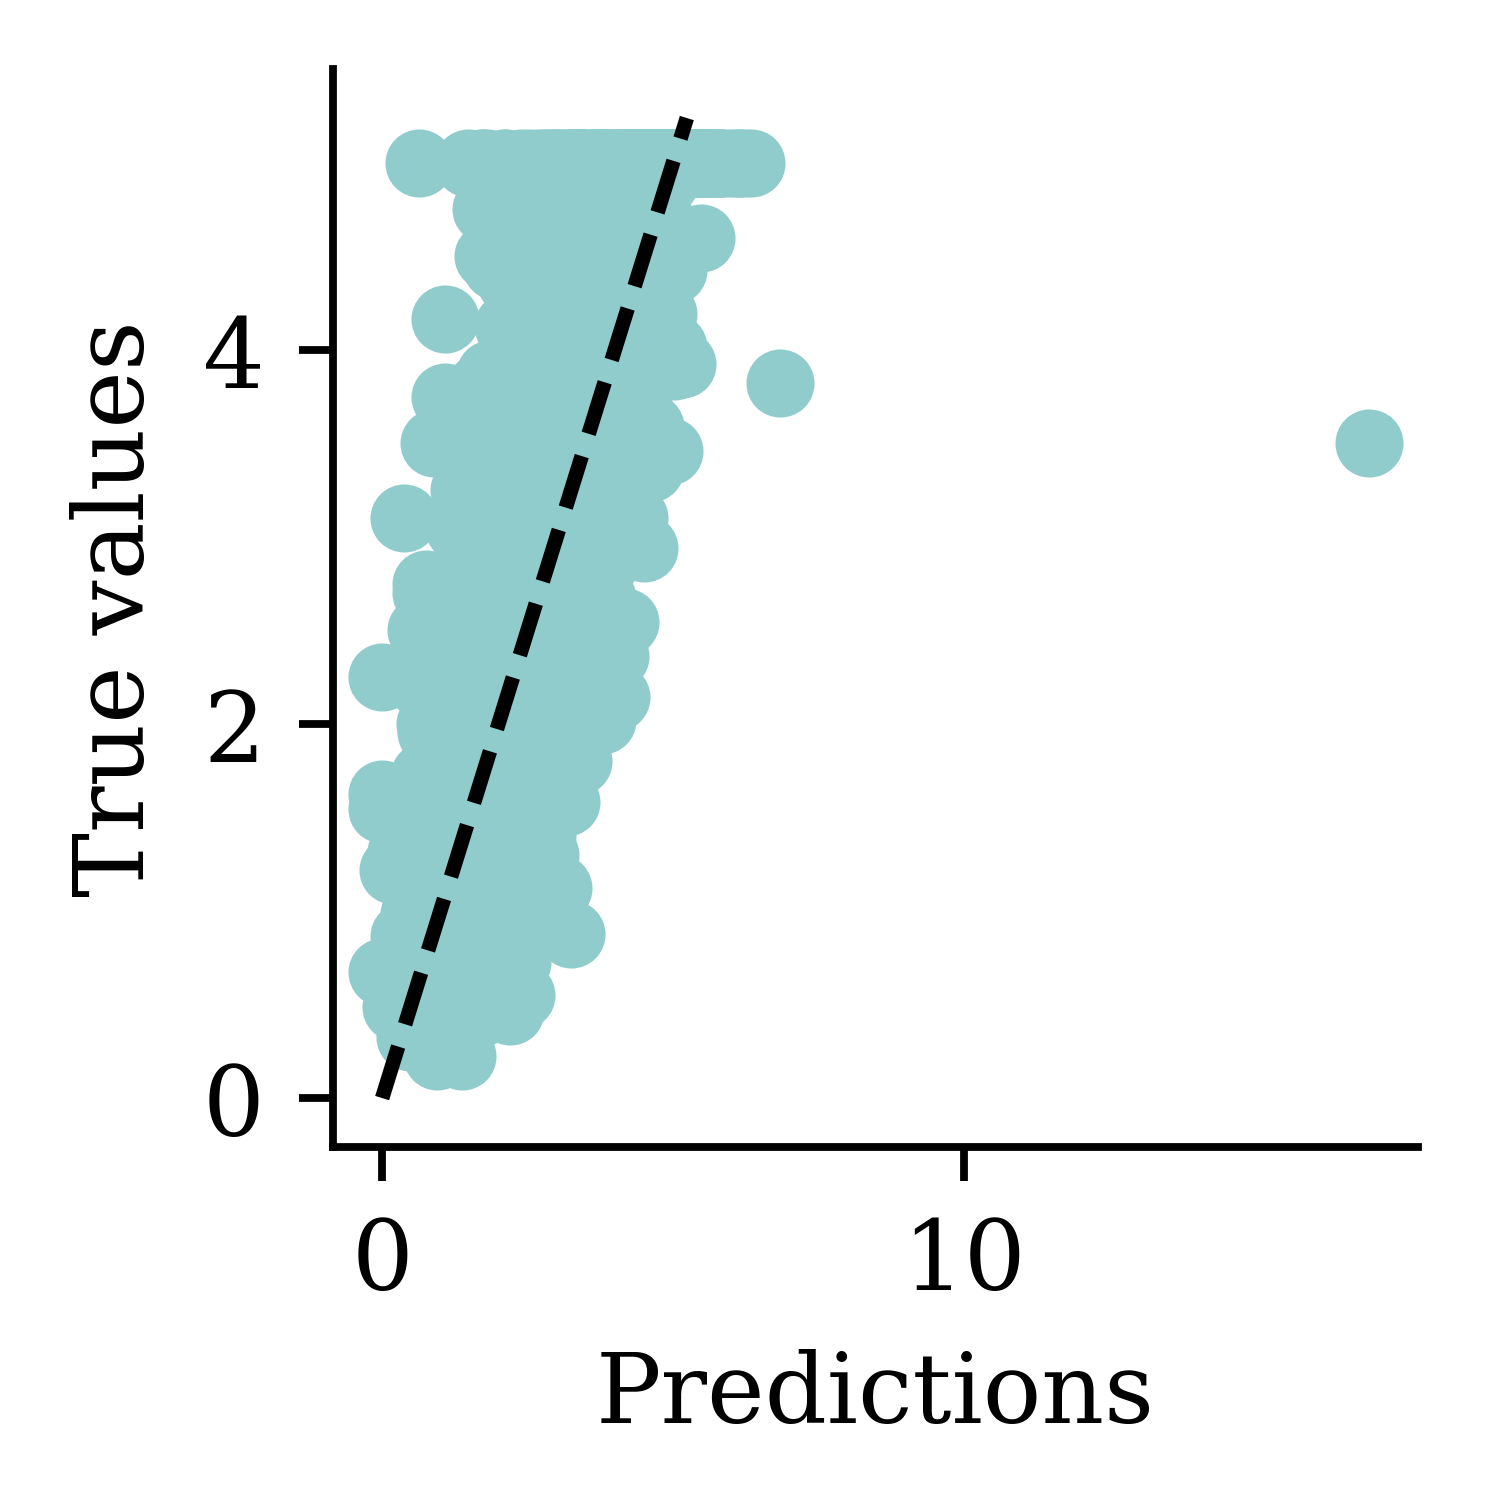
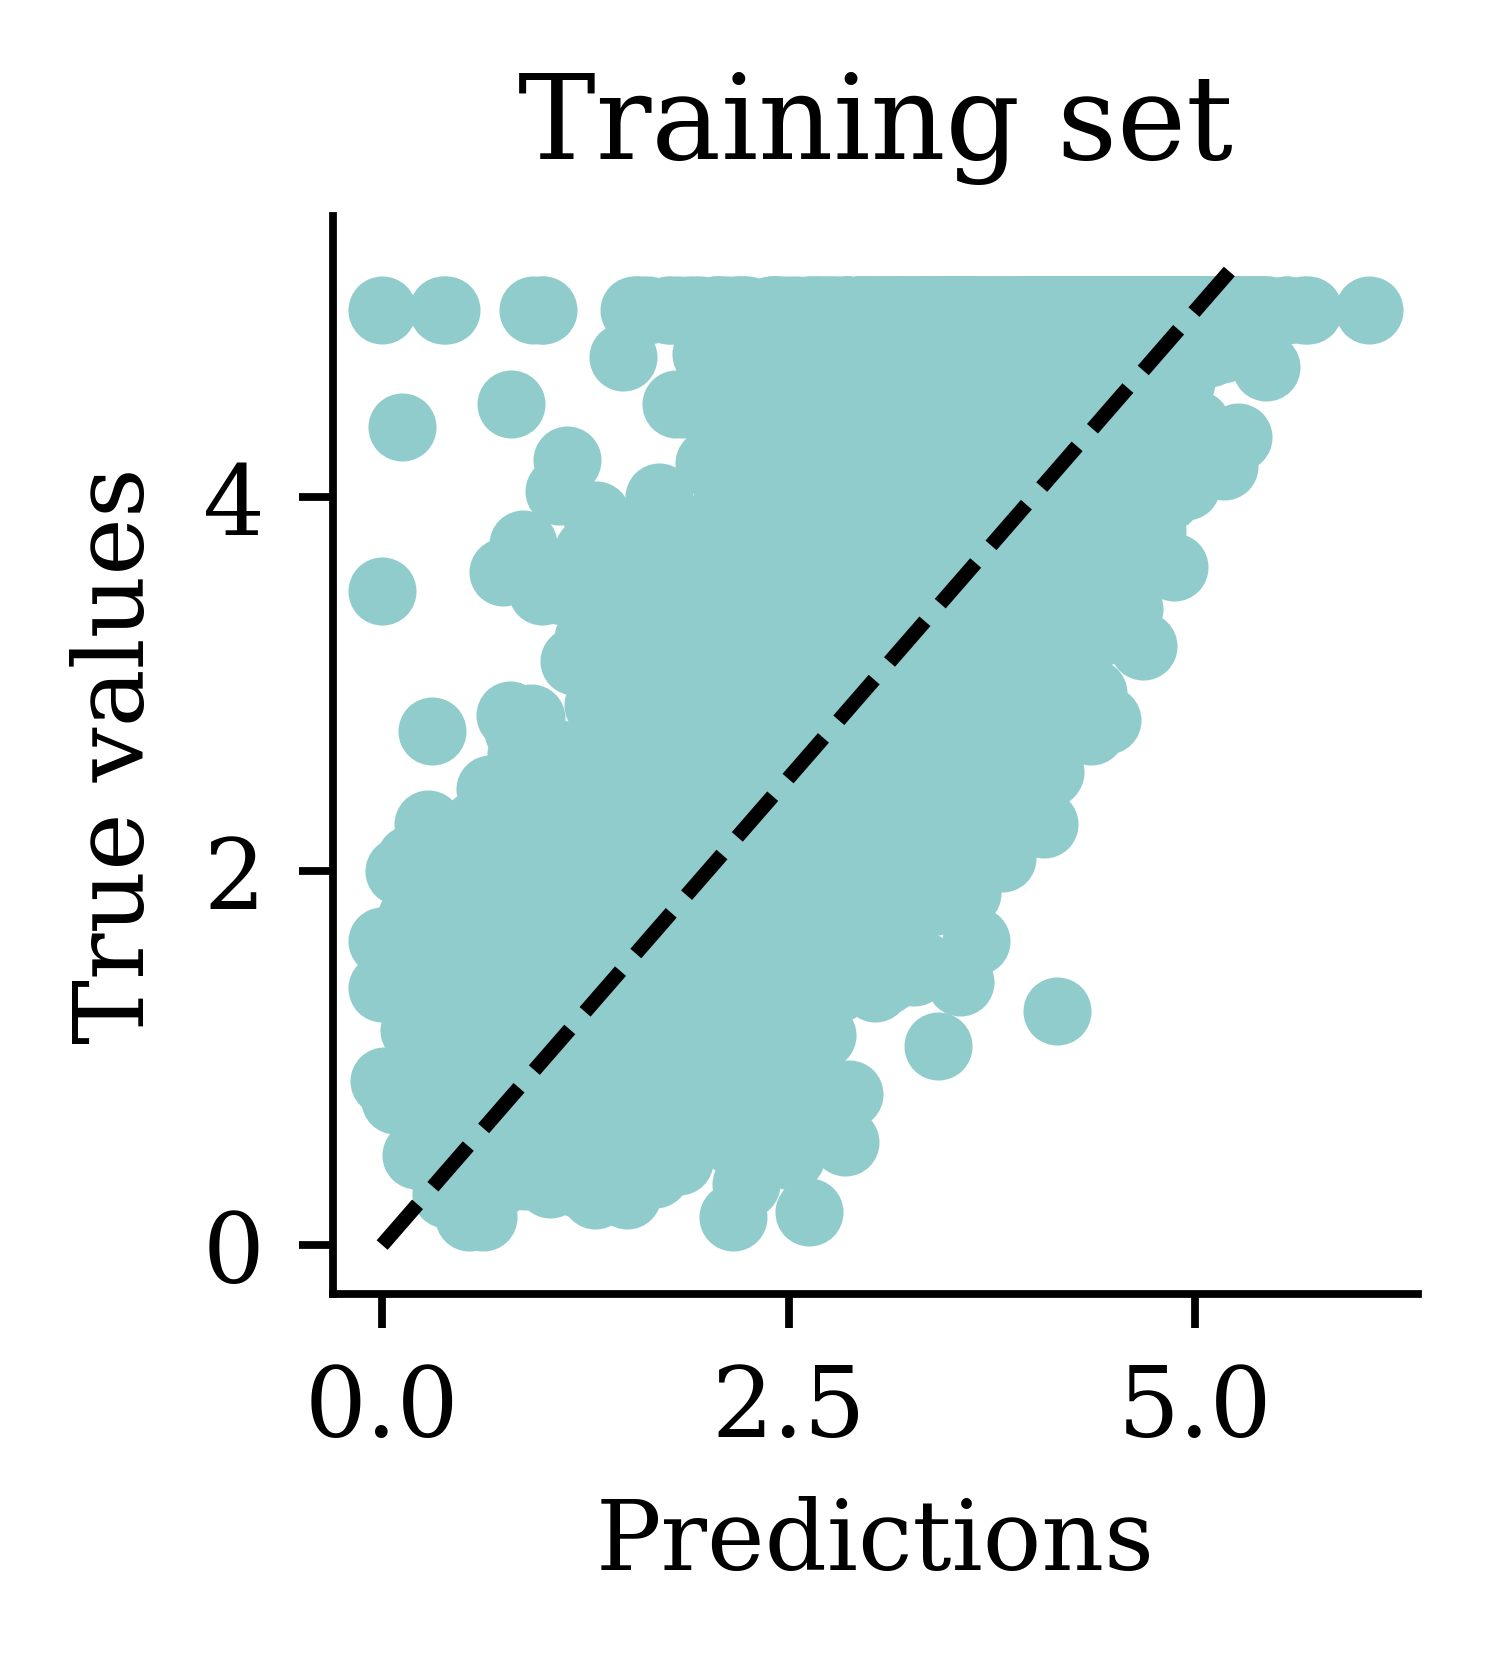
Predictions

y_pred = model.predict(X_val, verbose=0)
print(f"Min prediction: {y_pred.min():.2f}")
print(f"Max prediction: {y_pred.max():.2f}")
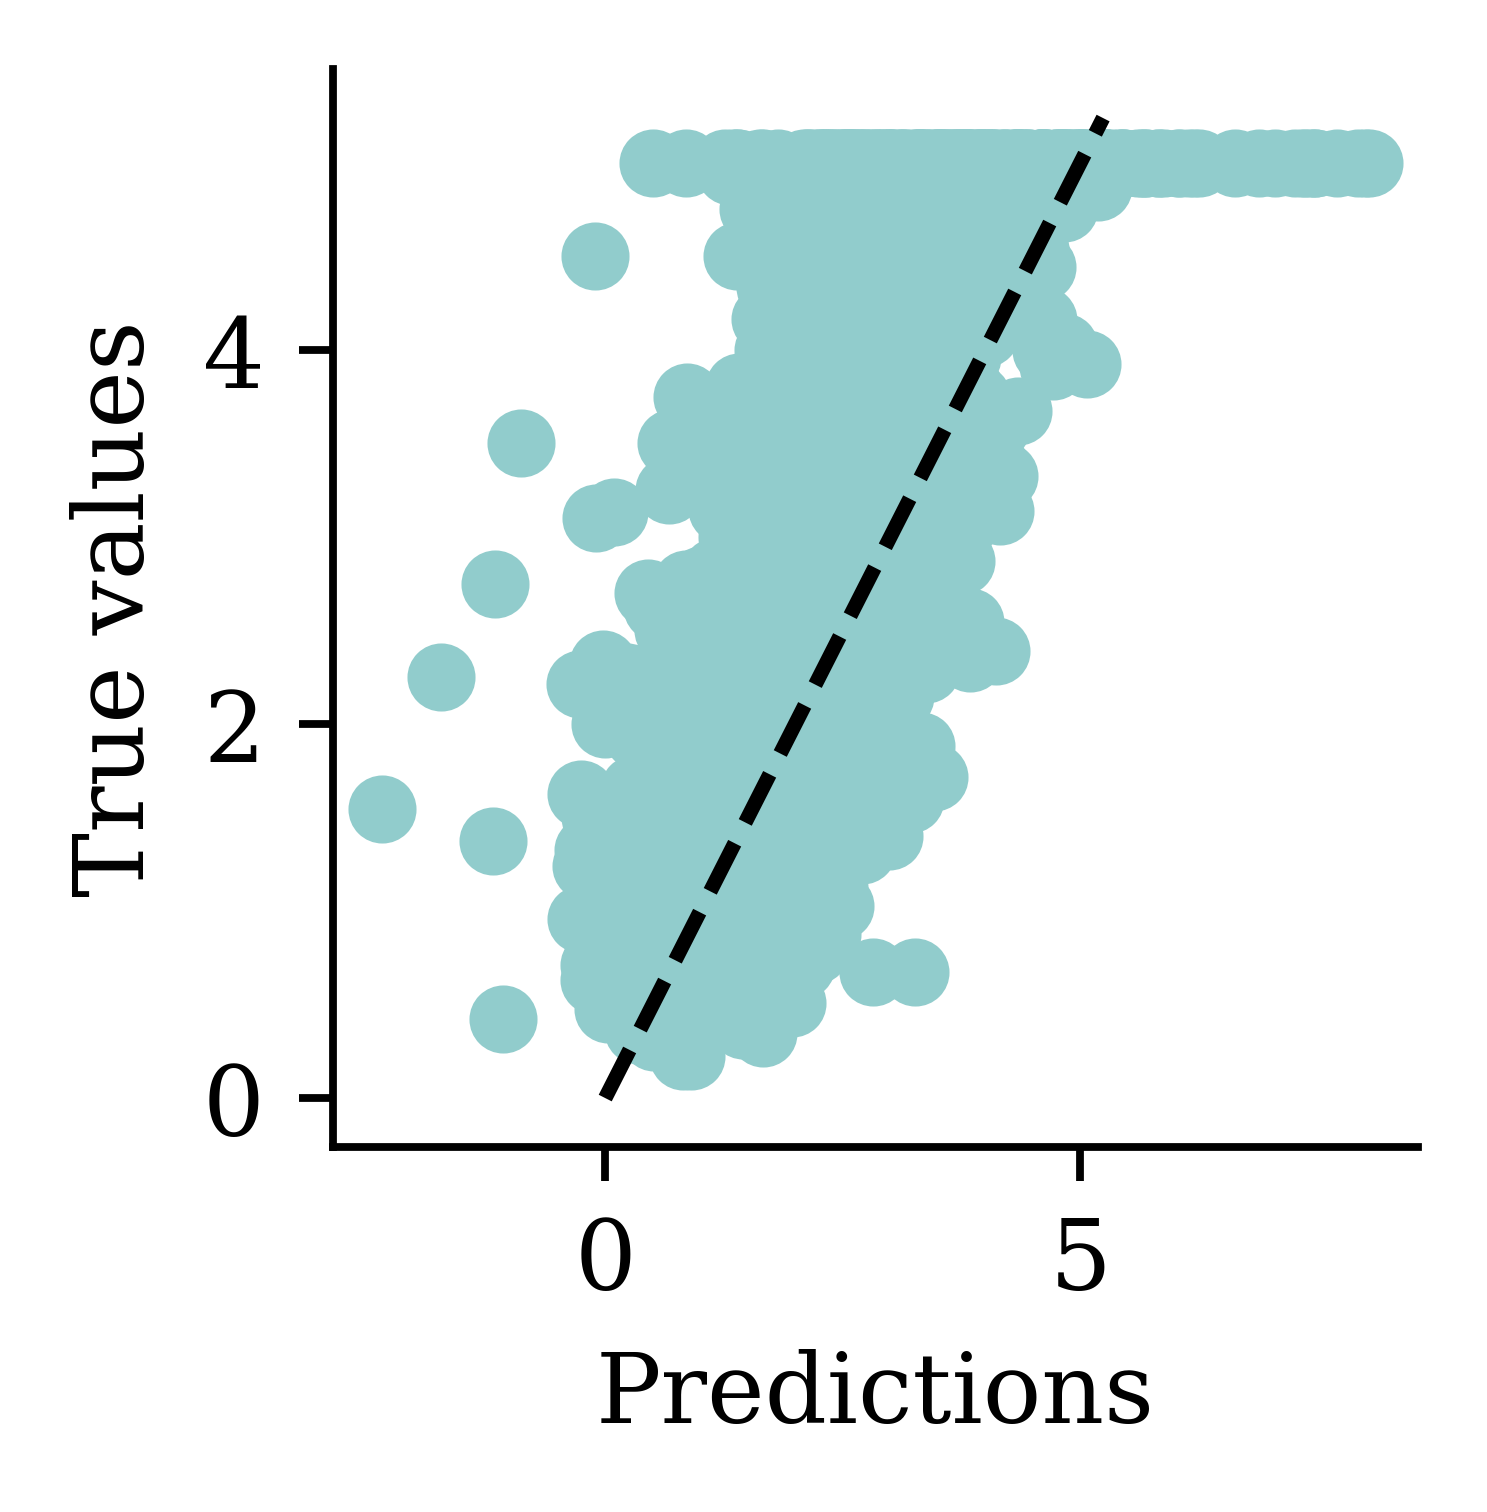
Min prediction: -2.35
Max prediction: 8.03
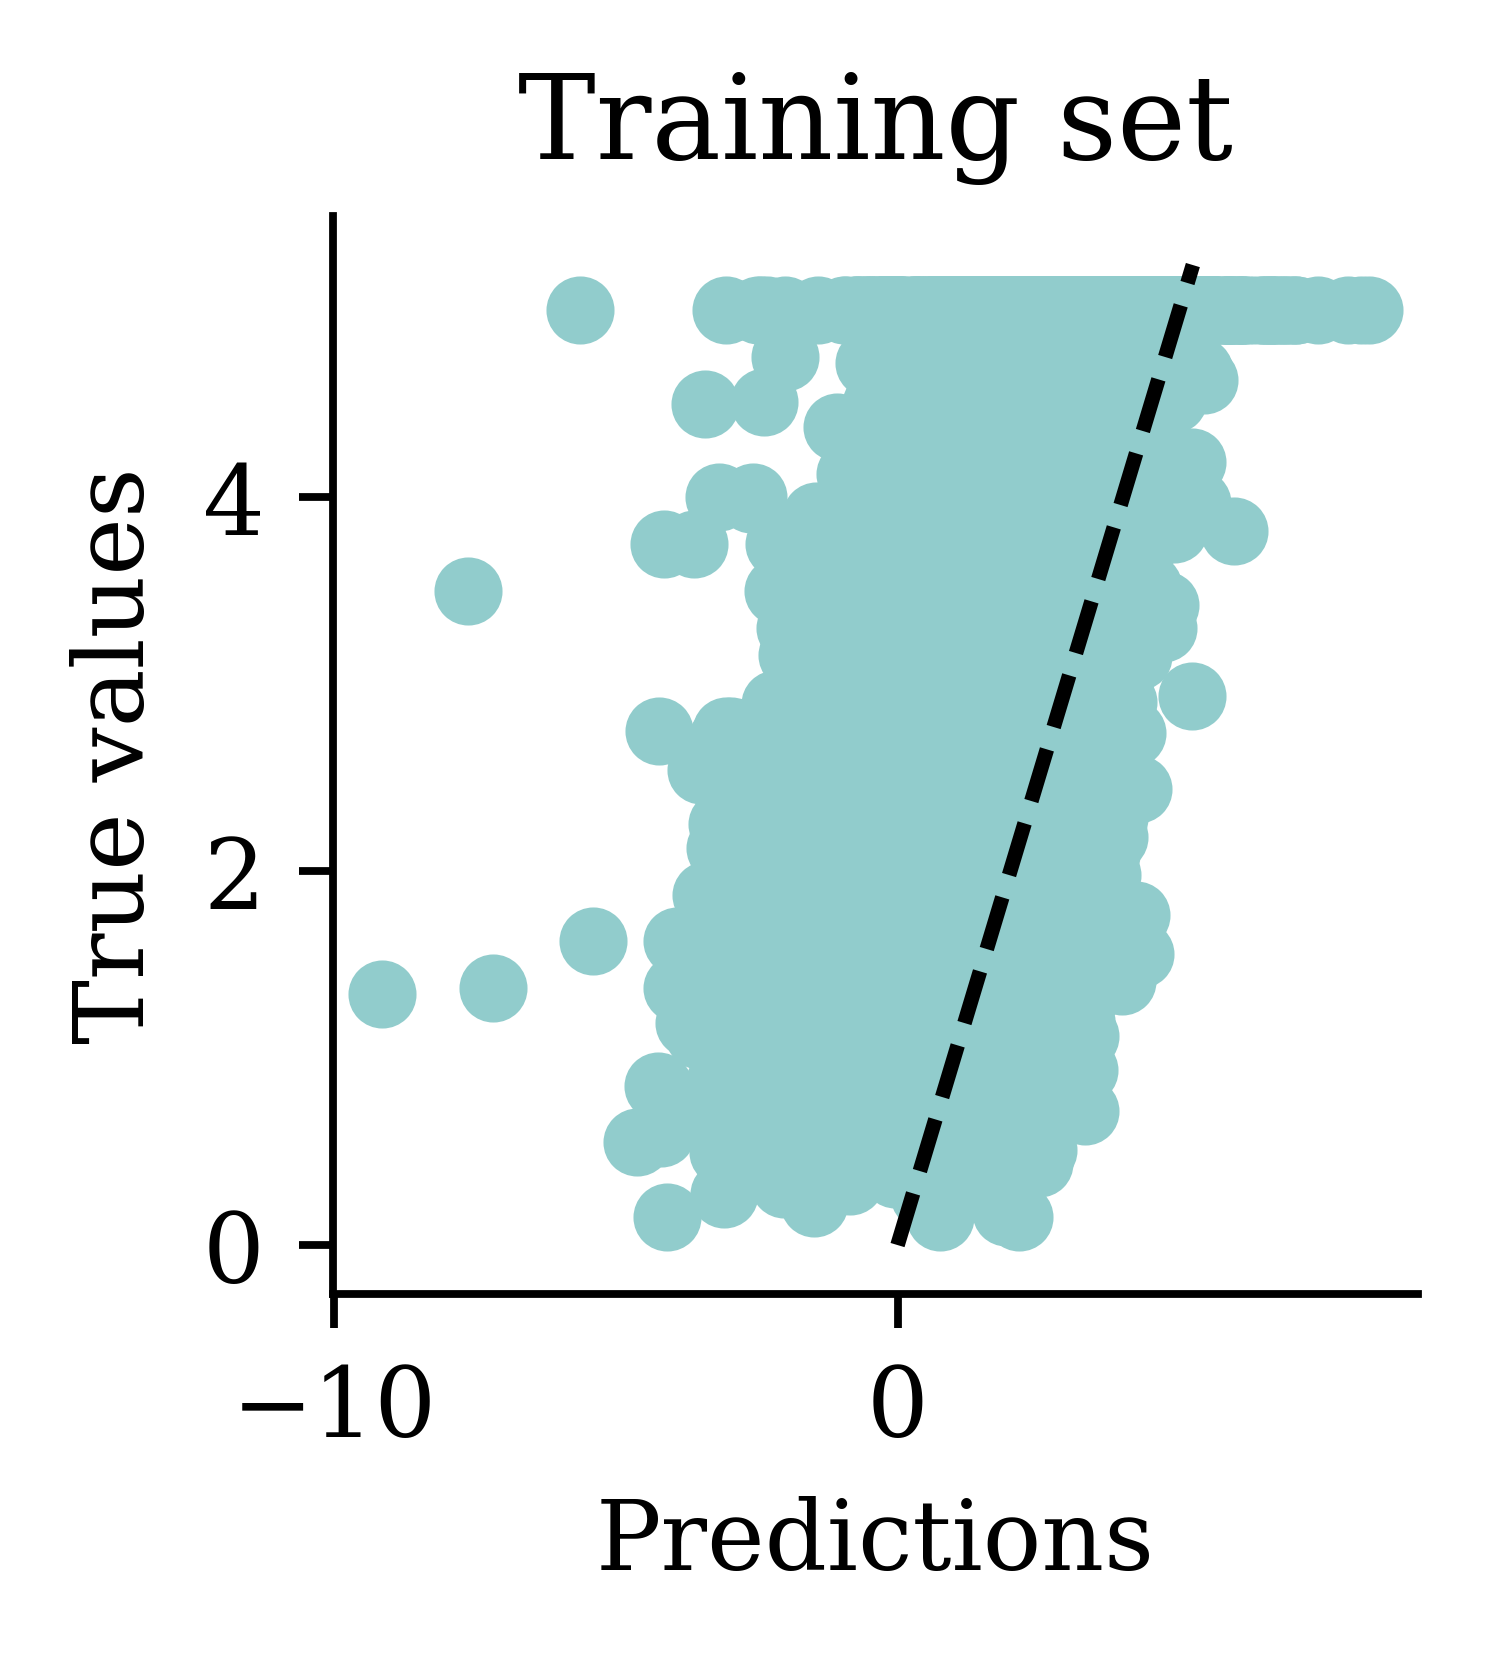
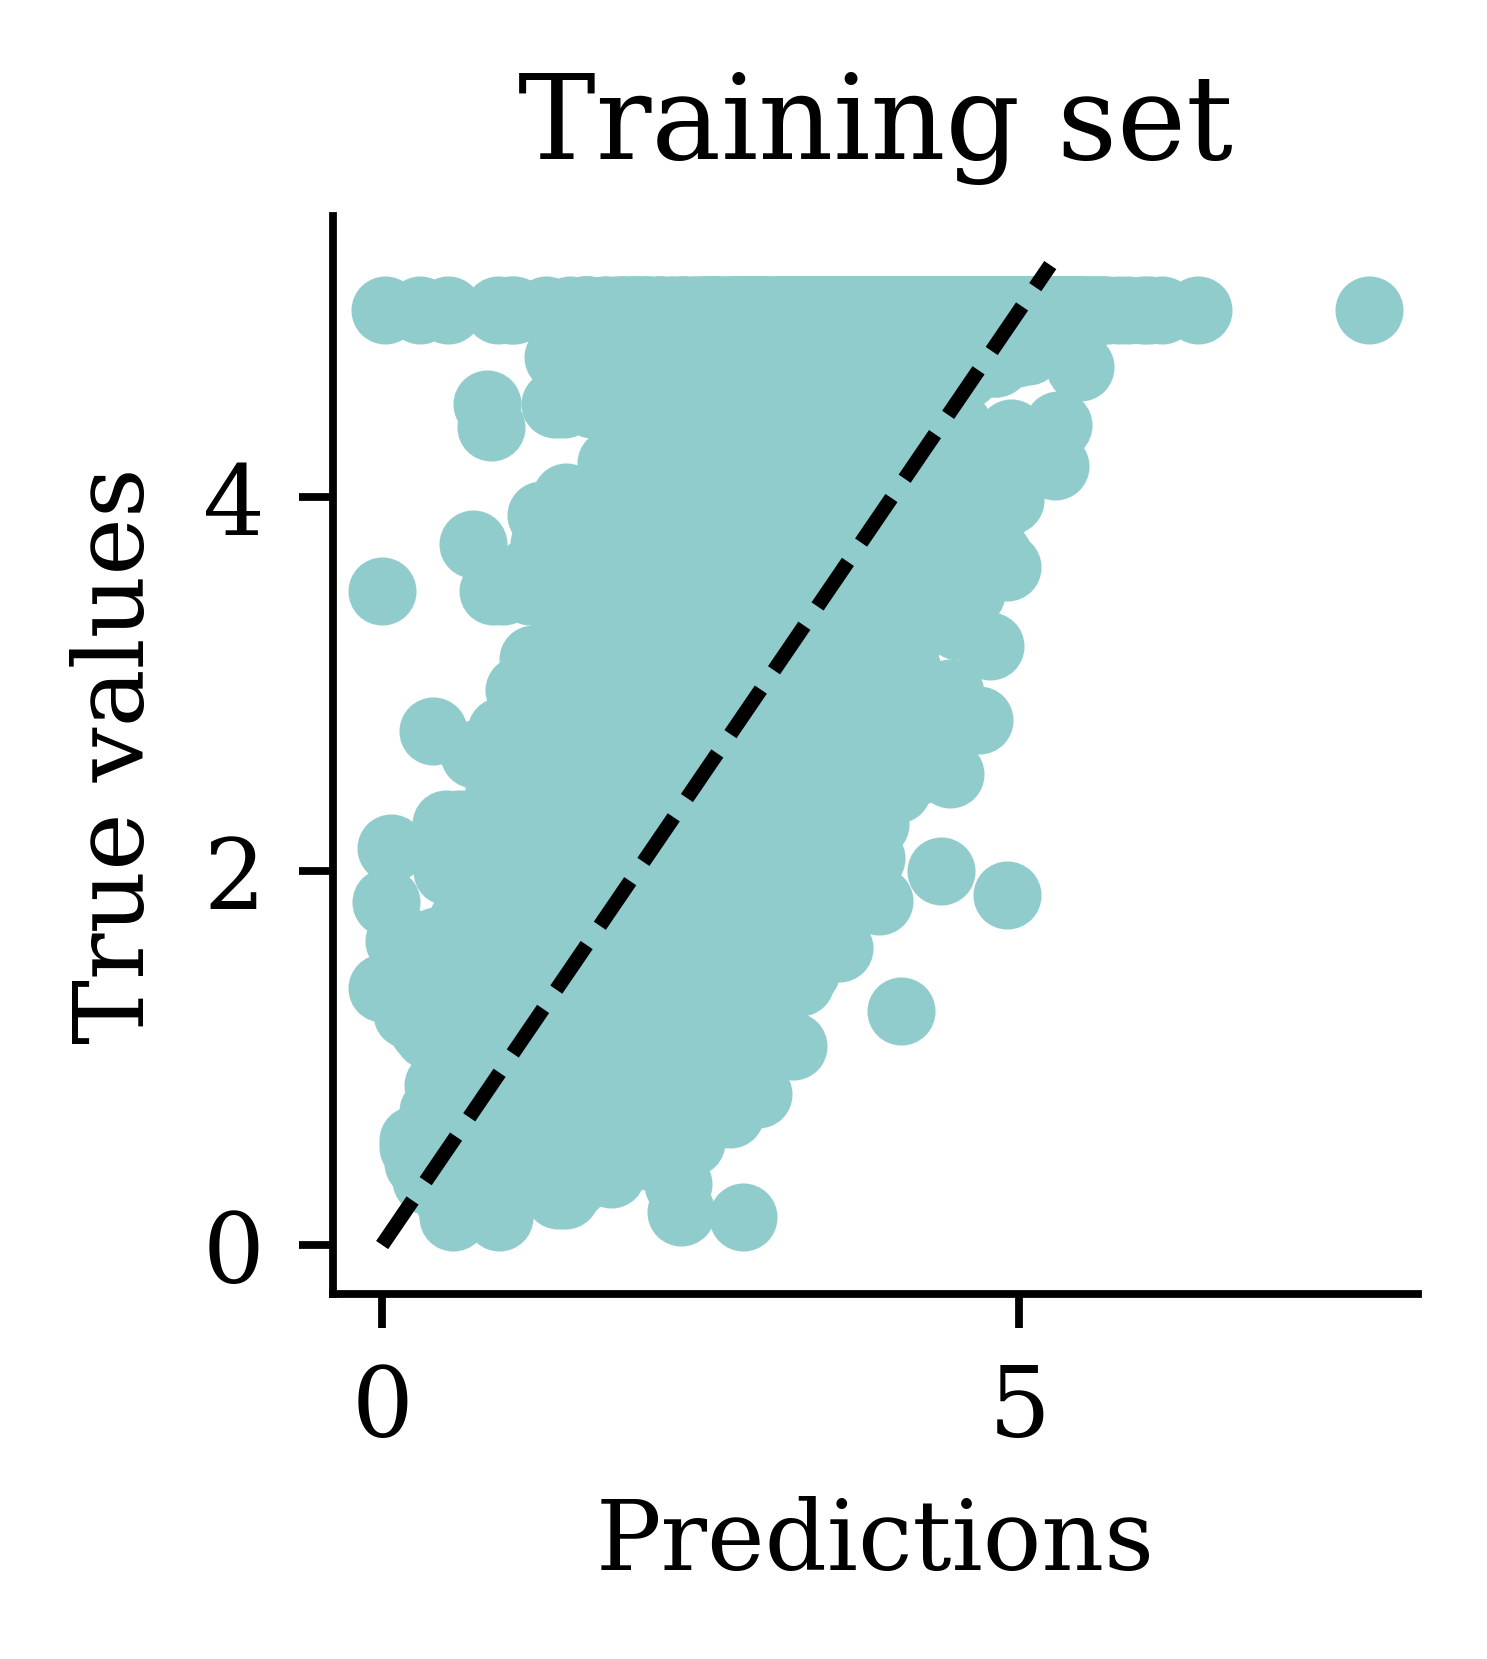
plt.scatter(y_pred, y_val)
plt.xlabel("Predictions")
plt.ylabel("True values")
add_diagonal_line()
mse_train["Long run ANN"] = mean_squared_error(
    y_train, model.predict(X_train, verbose=0)
)
mse_val["Long run ANN"] = mean_squared_error(y_val, model.predict(X_val, verbose=0))

Try different activation functions

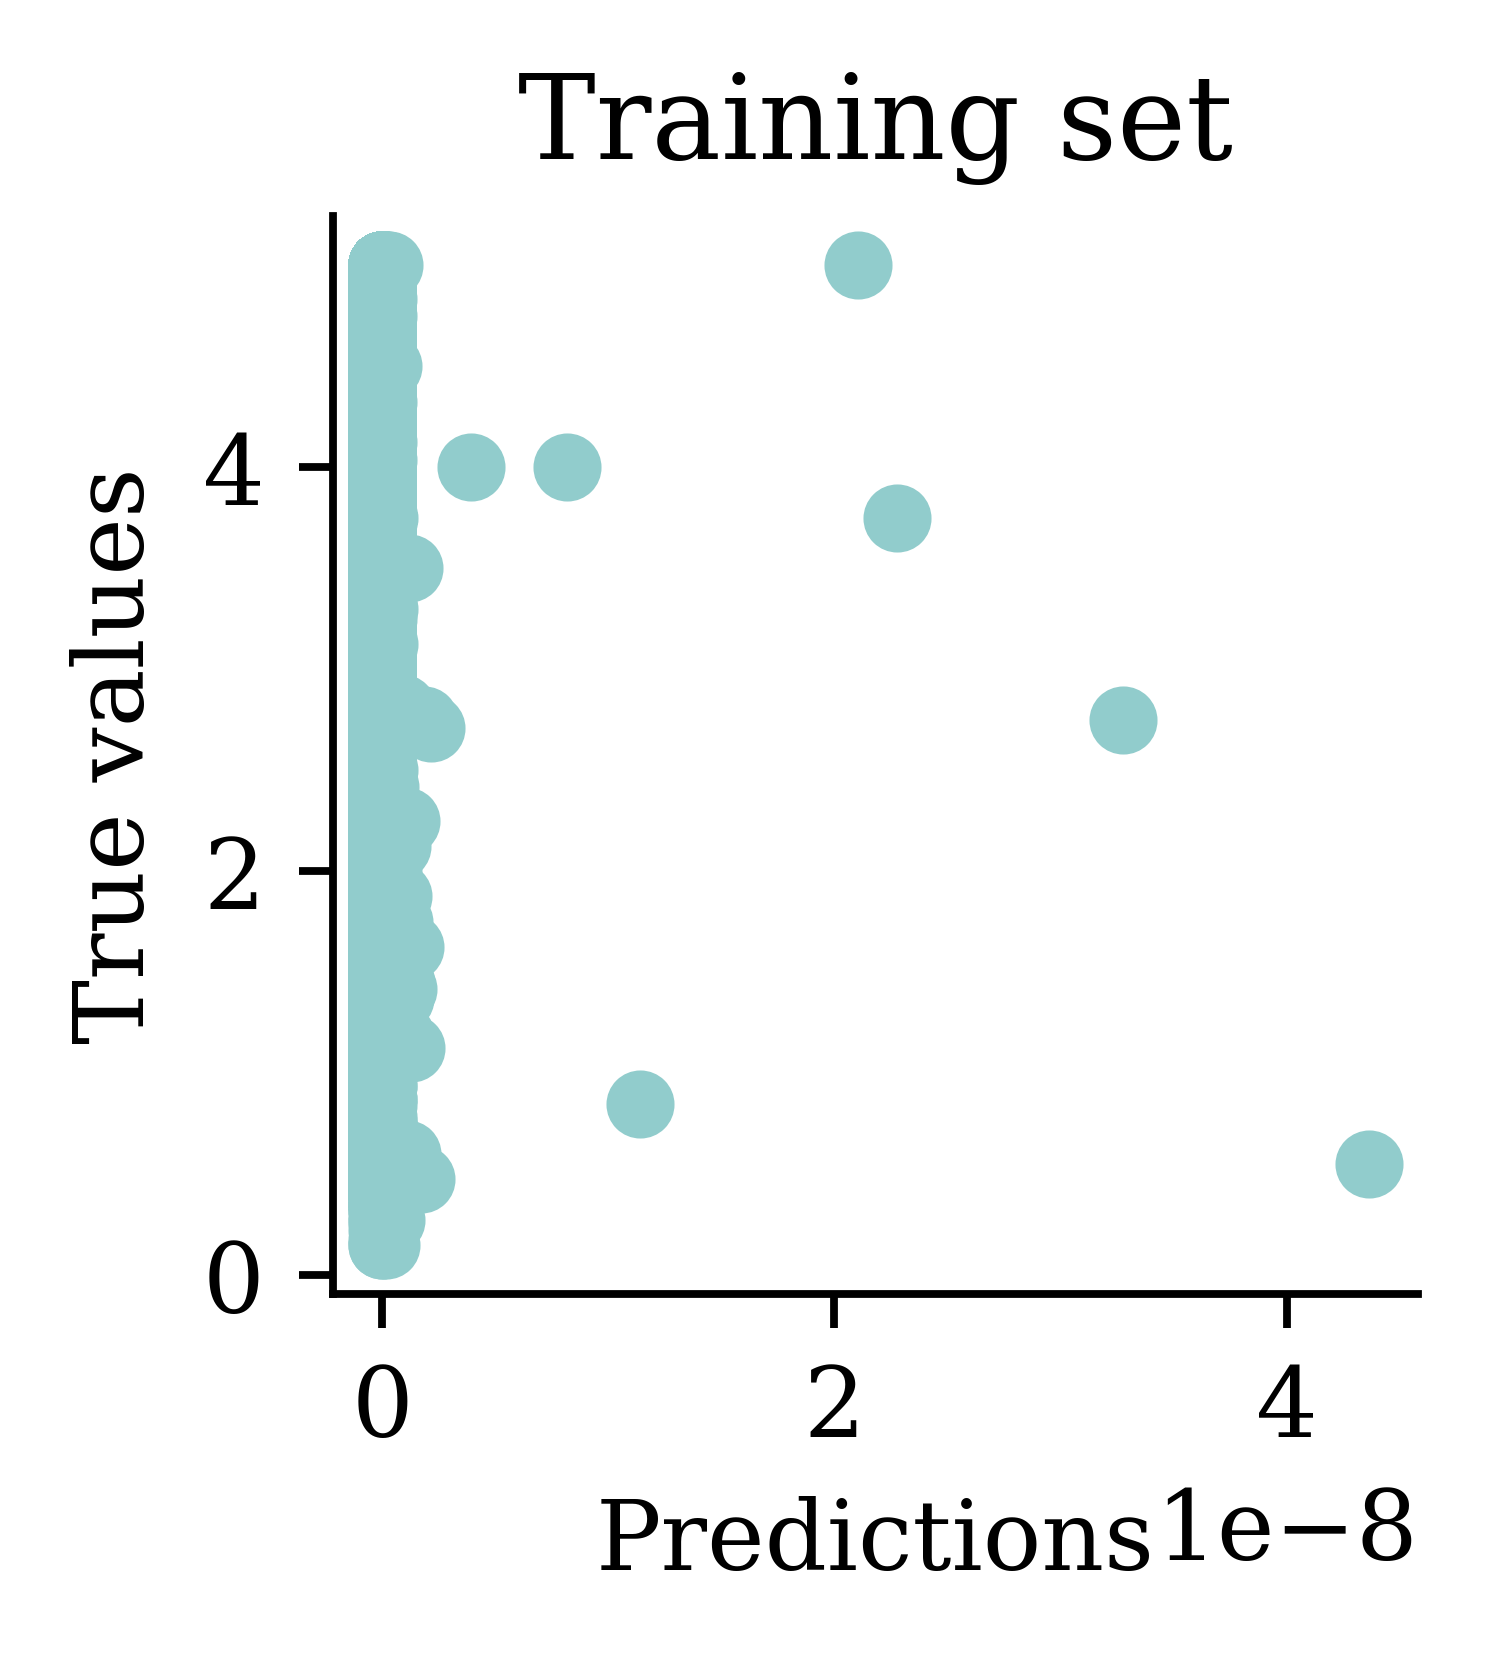
Enforce positive outputs (softplus)

random.seed(123)

model = Sequential([
    Dense(30, activation="leaky_relu"),
    Dense(1, activation="softplus")
])

model.compile("adam", "mse")

%time hist = model.fit(X_train, y_train, epochs=50, \
    verbose=False)

losses = np.round(hist.history["loss"], 2)
print(losses[:5], "...", losses[-5:])
CPU times: user 33.8 s, sys: 930 ms, total: 34.7 s
Wall time: 34.1 s
[5.65 5.64 5.64 5.64 5.64] ... [5.64 5.64 5.64 5.64 5.64]

Plot the predictions

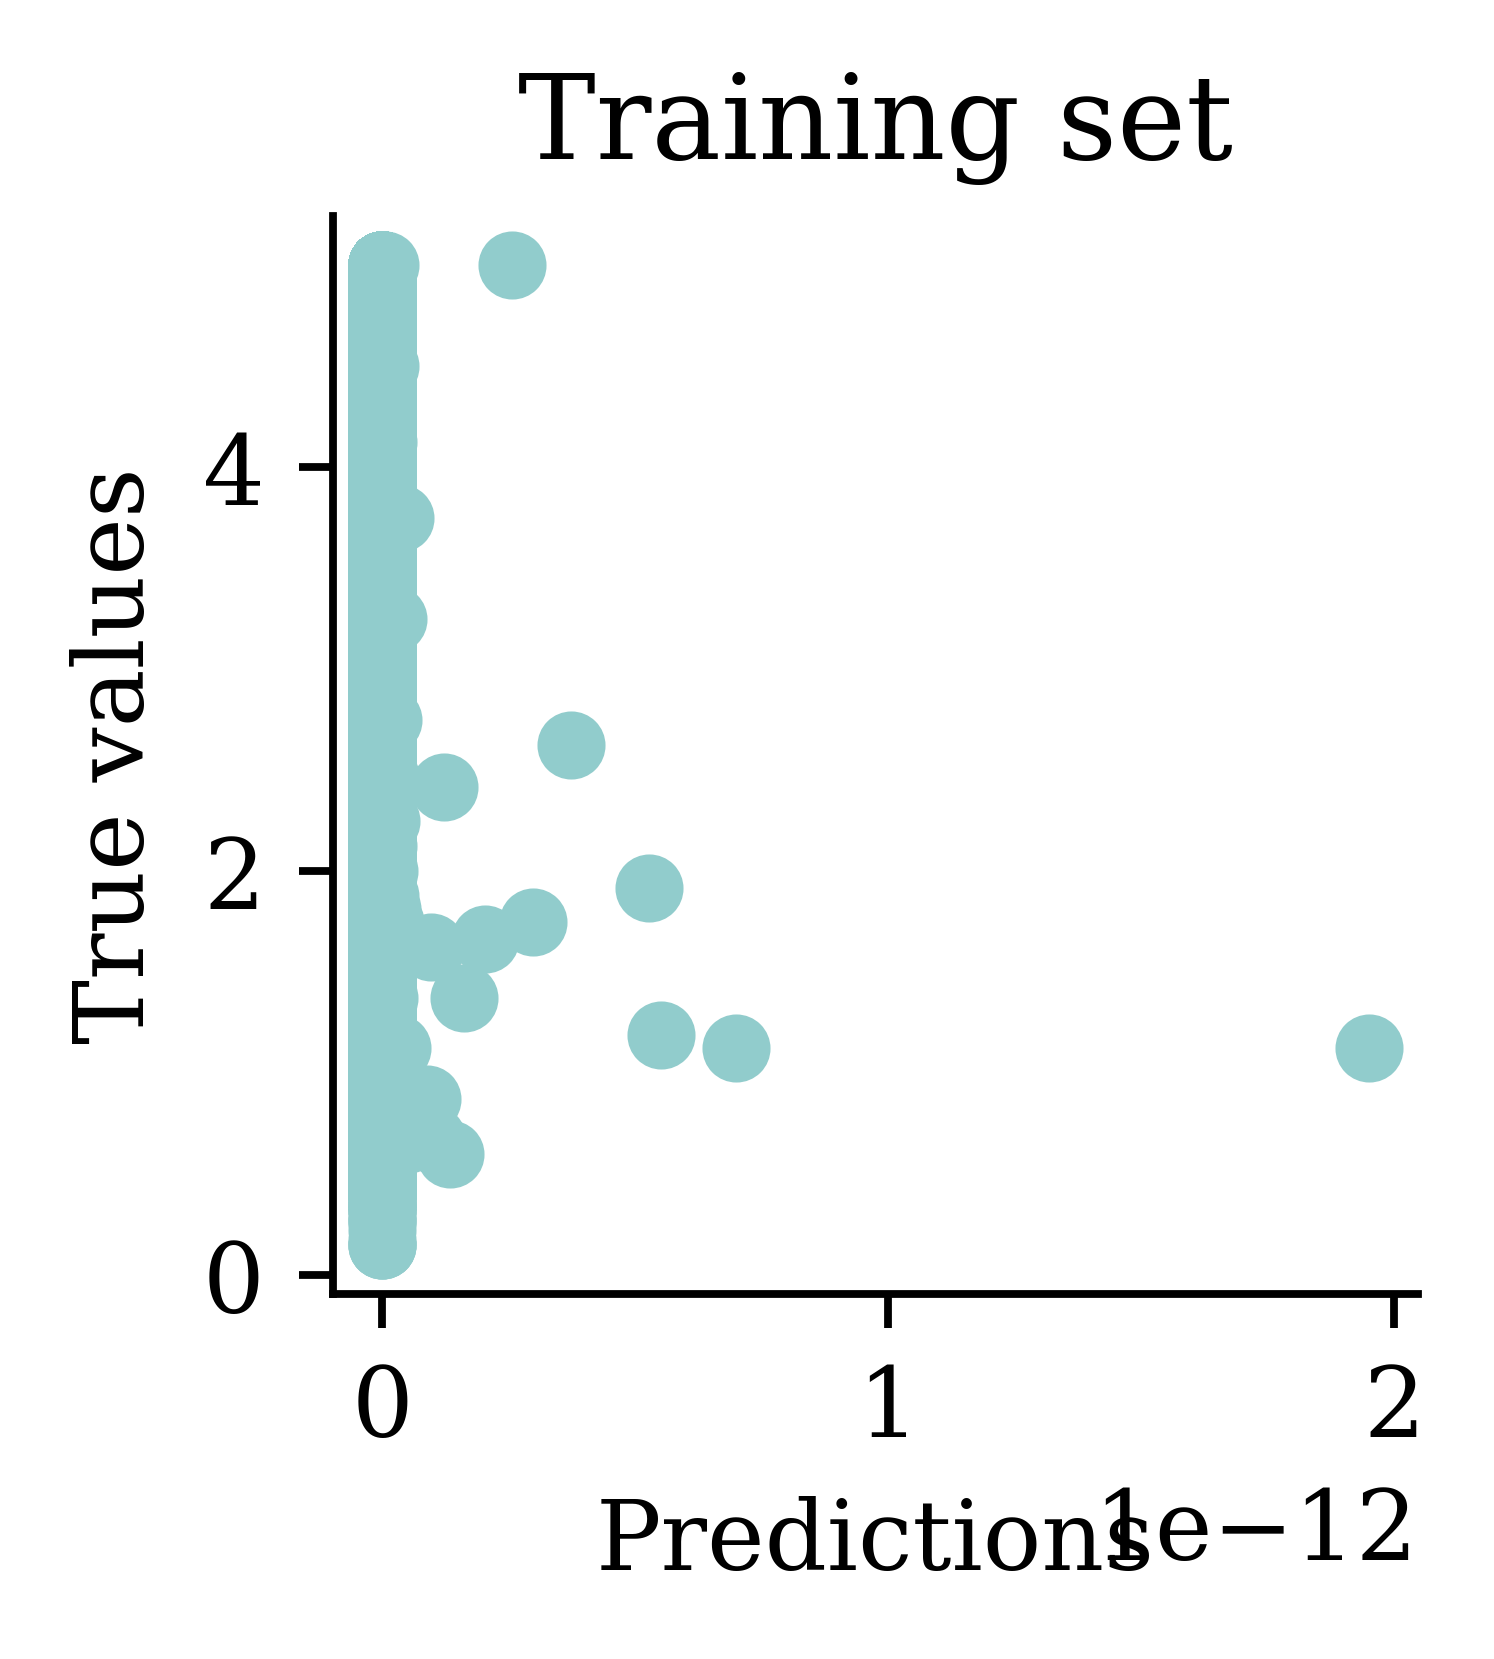
Enforce positive outputs (\mathrm{e}^{\,x})

random.seed(123)

model = Sequential([
    Dense(30, activation="leaky_relu"),
    Dense(1, activation="exponential")
])

model.compile("adam", "mse")

%time hist = model.fit(X_train, y_train, epochs=5, verbose=False)

losses = hist.history["loss"]
print(losses)
CPU times: user 3.43 s, sys: 84.2 ms, total: 3.51 s
Wall time: 3.45 s
[50286.49609375, 6.613603591918945, 6.612048149108887, 6.609488010406494, 6.605171203613281]

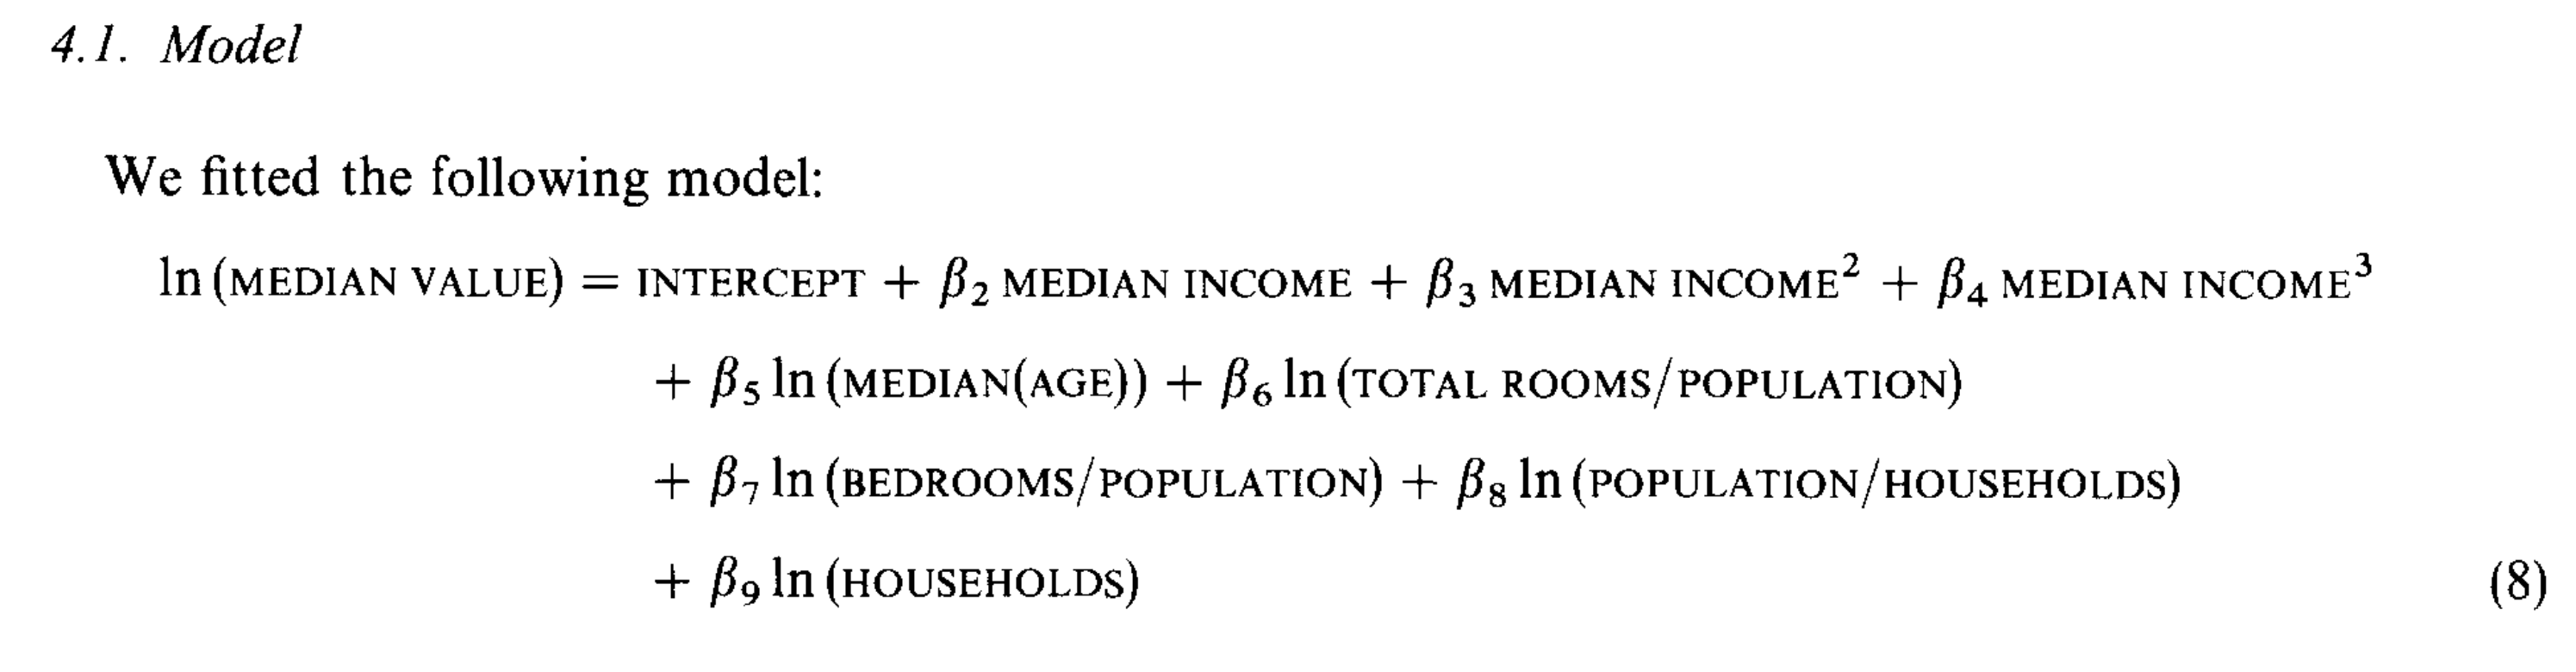
Same as transforming the target

The polynomial regression used by researchers who first studied this dataset.

Note

Fitting \ln(\text{Median Value}) is mathematically identical to the exponential activation function in the final layer (but metrics are in different units).

Good to know others results
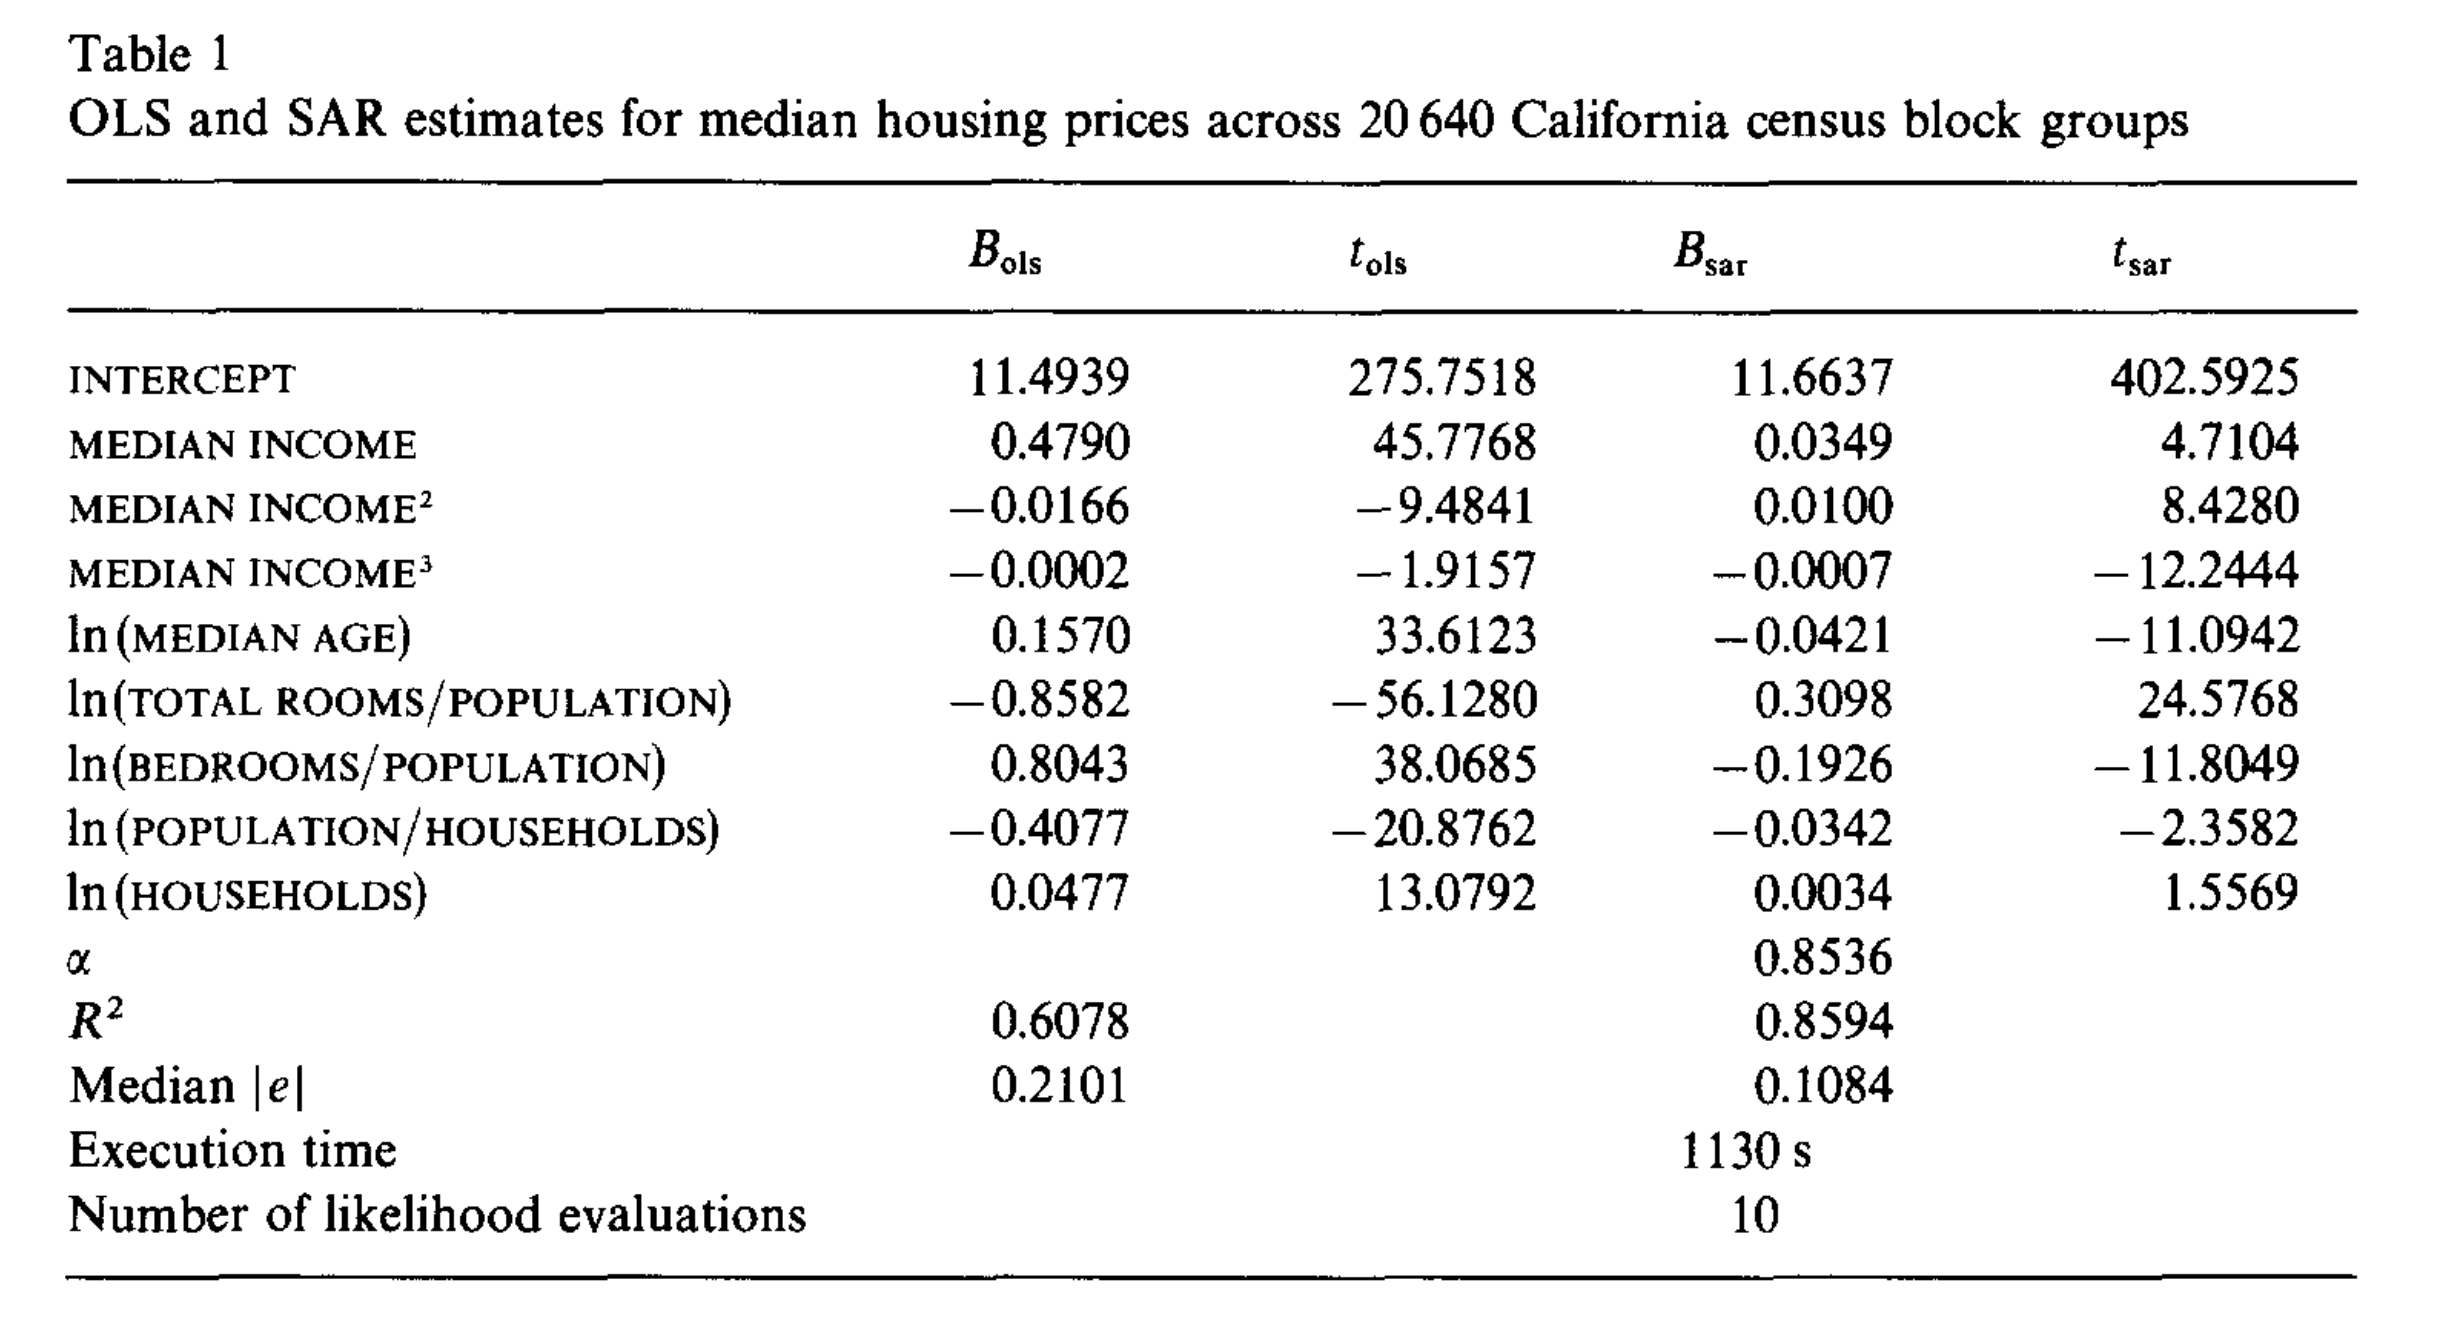
That basic model gets R^2 of 0.61, but their fancy model gets 0.86.

GPT can double-check these results
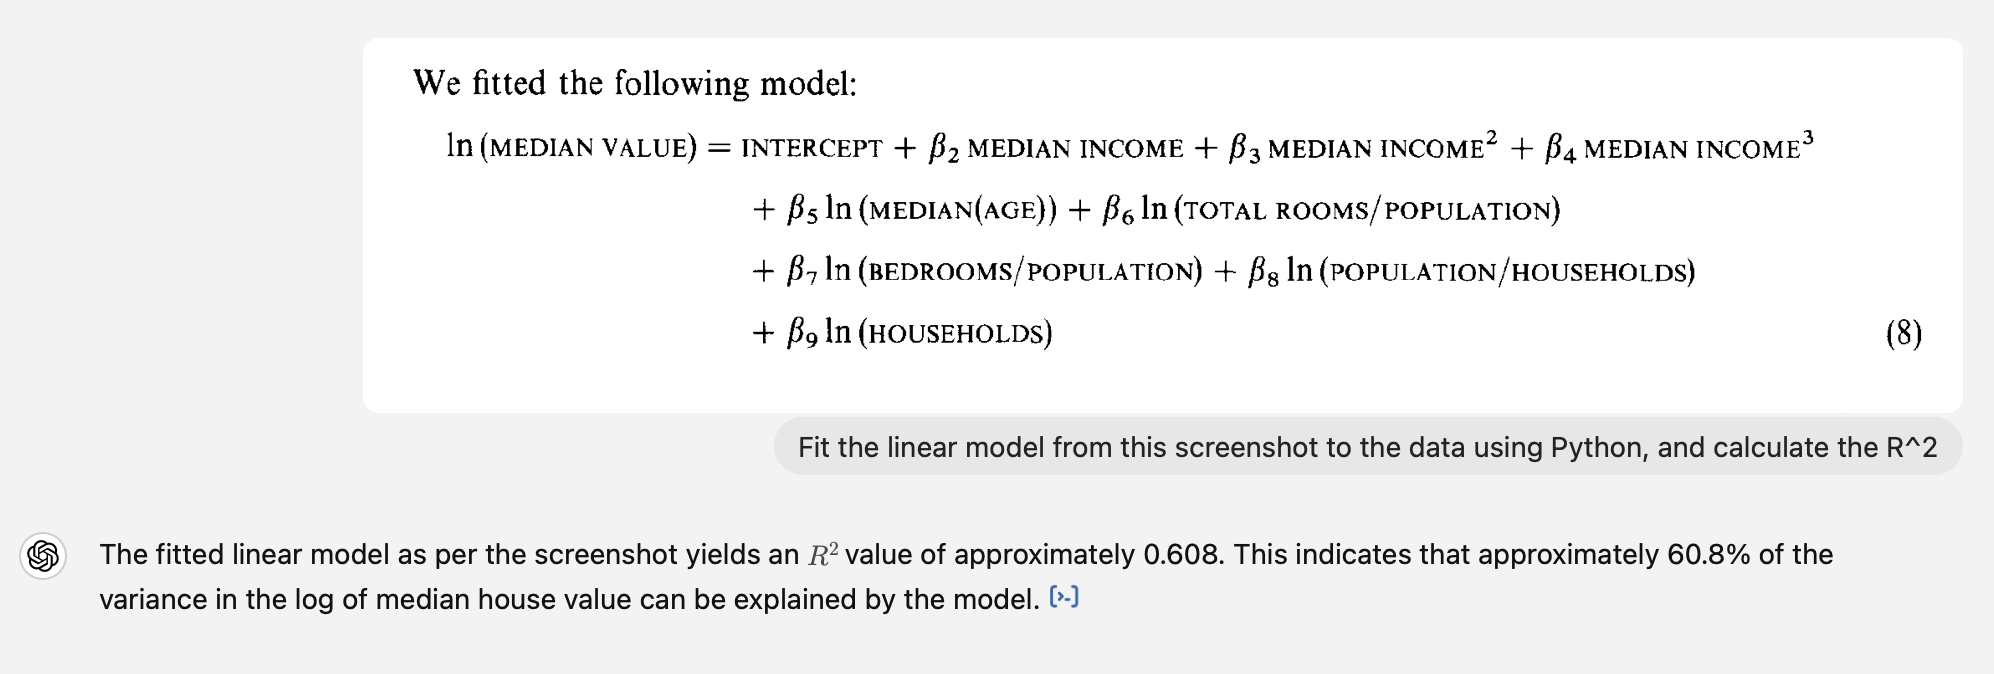
Asking GPT to check it.

I’d previously given it the CSV of the data.
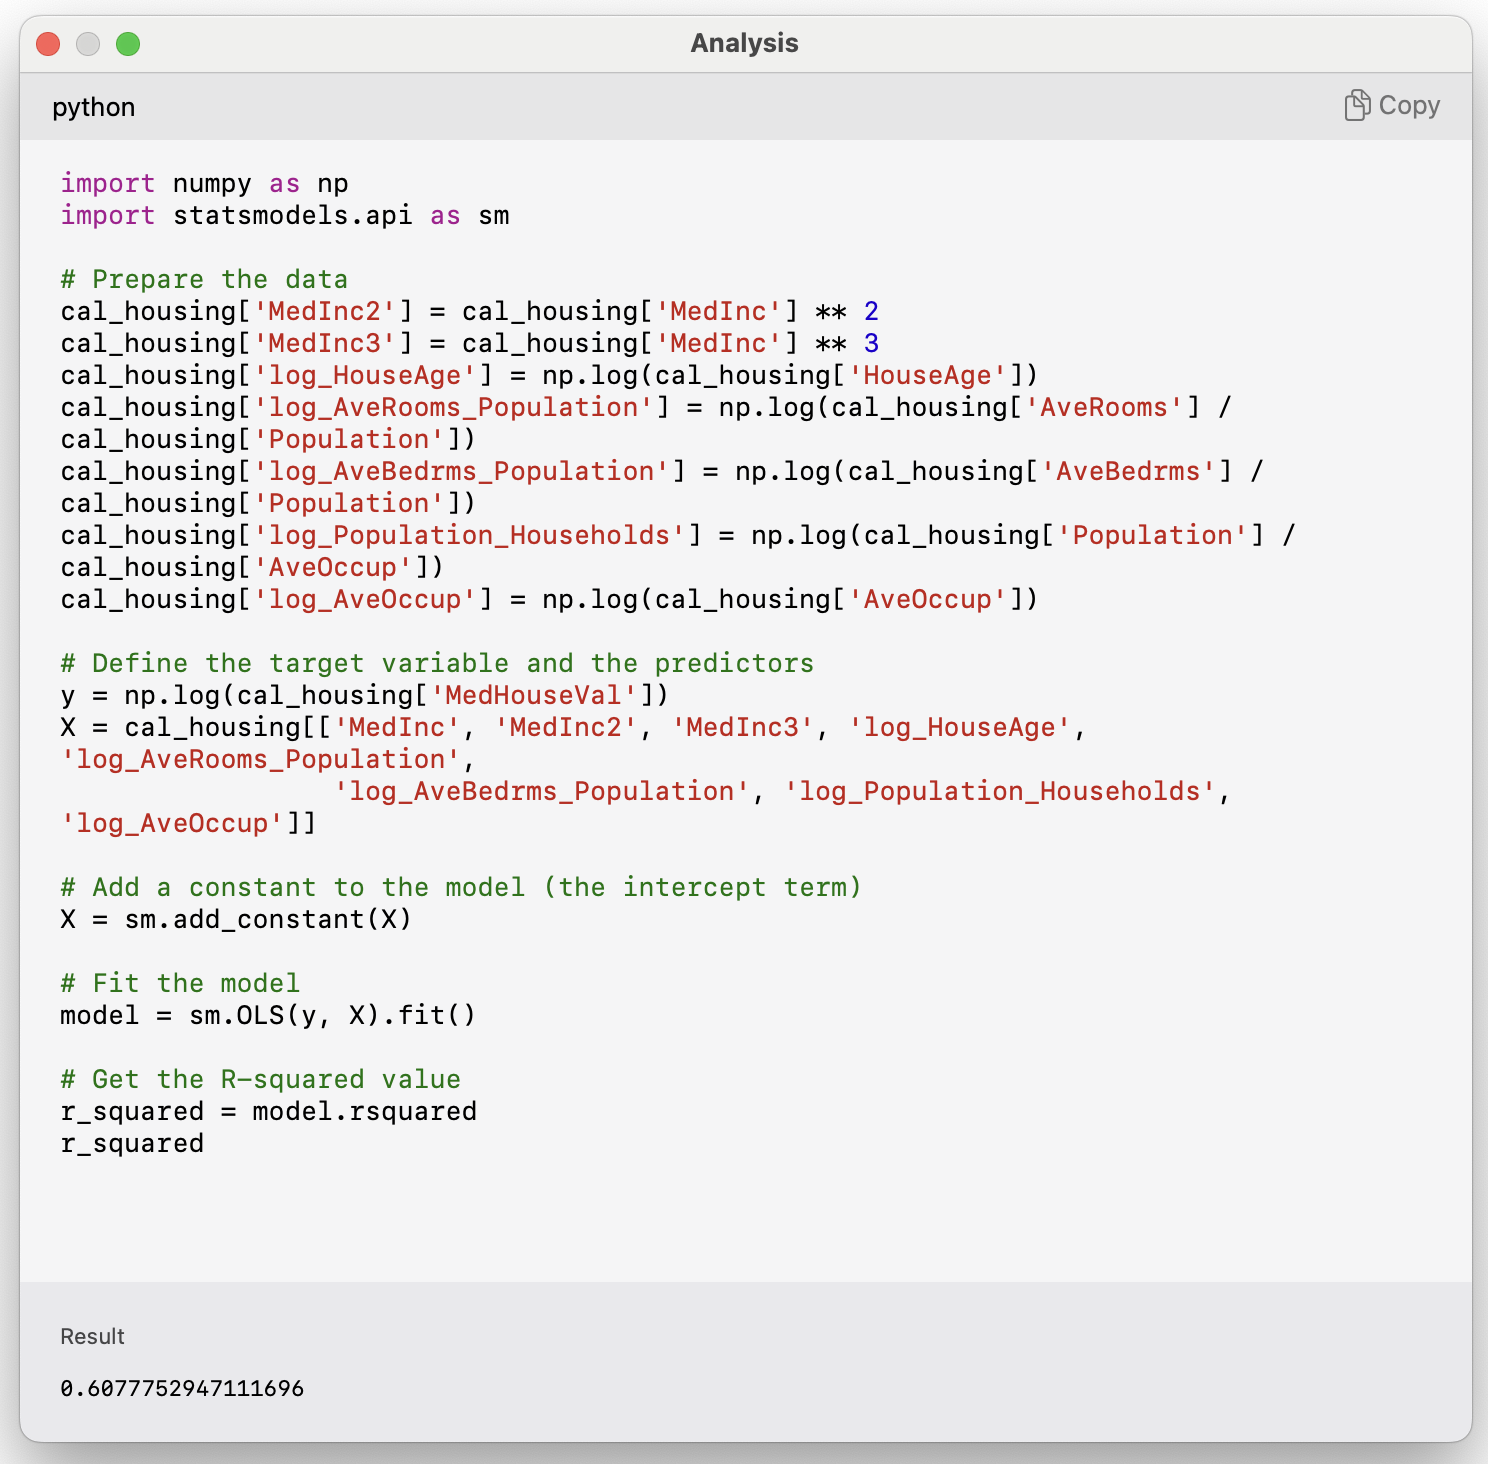
The code it wrote & ran.

Preprocessing

Lecture Outline

  • Artificial Intelligence

  • Deep Learning Successes (Images)

  • Deep Learning Successes (Text)

  • Classifying Machine Learning Tasks

  • Neural Networks

  • California House Price Prediction

  • Our First Neural Network

  • Force positive predictions

  • Preprocessing

  • Early Stopping

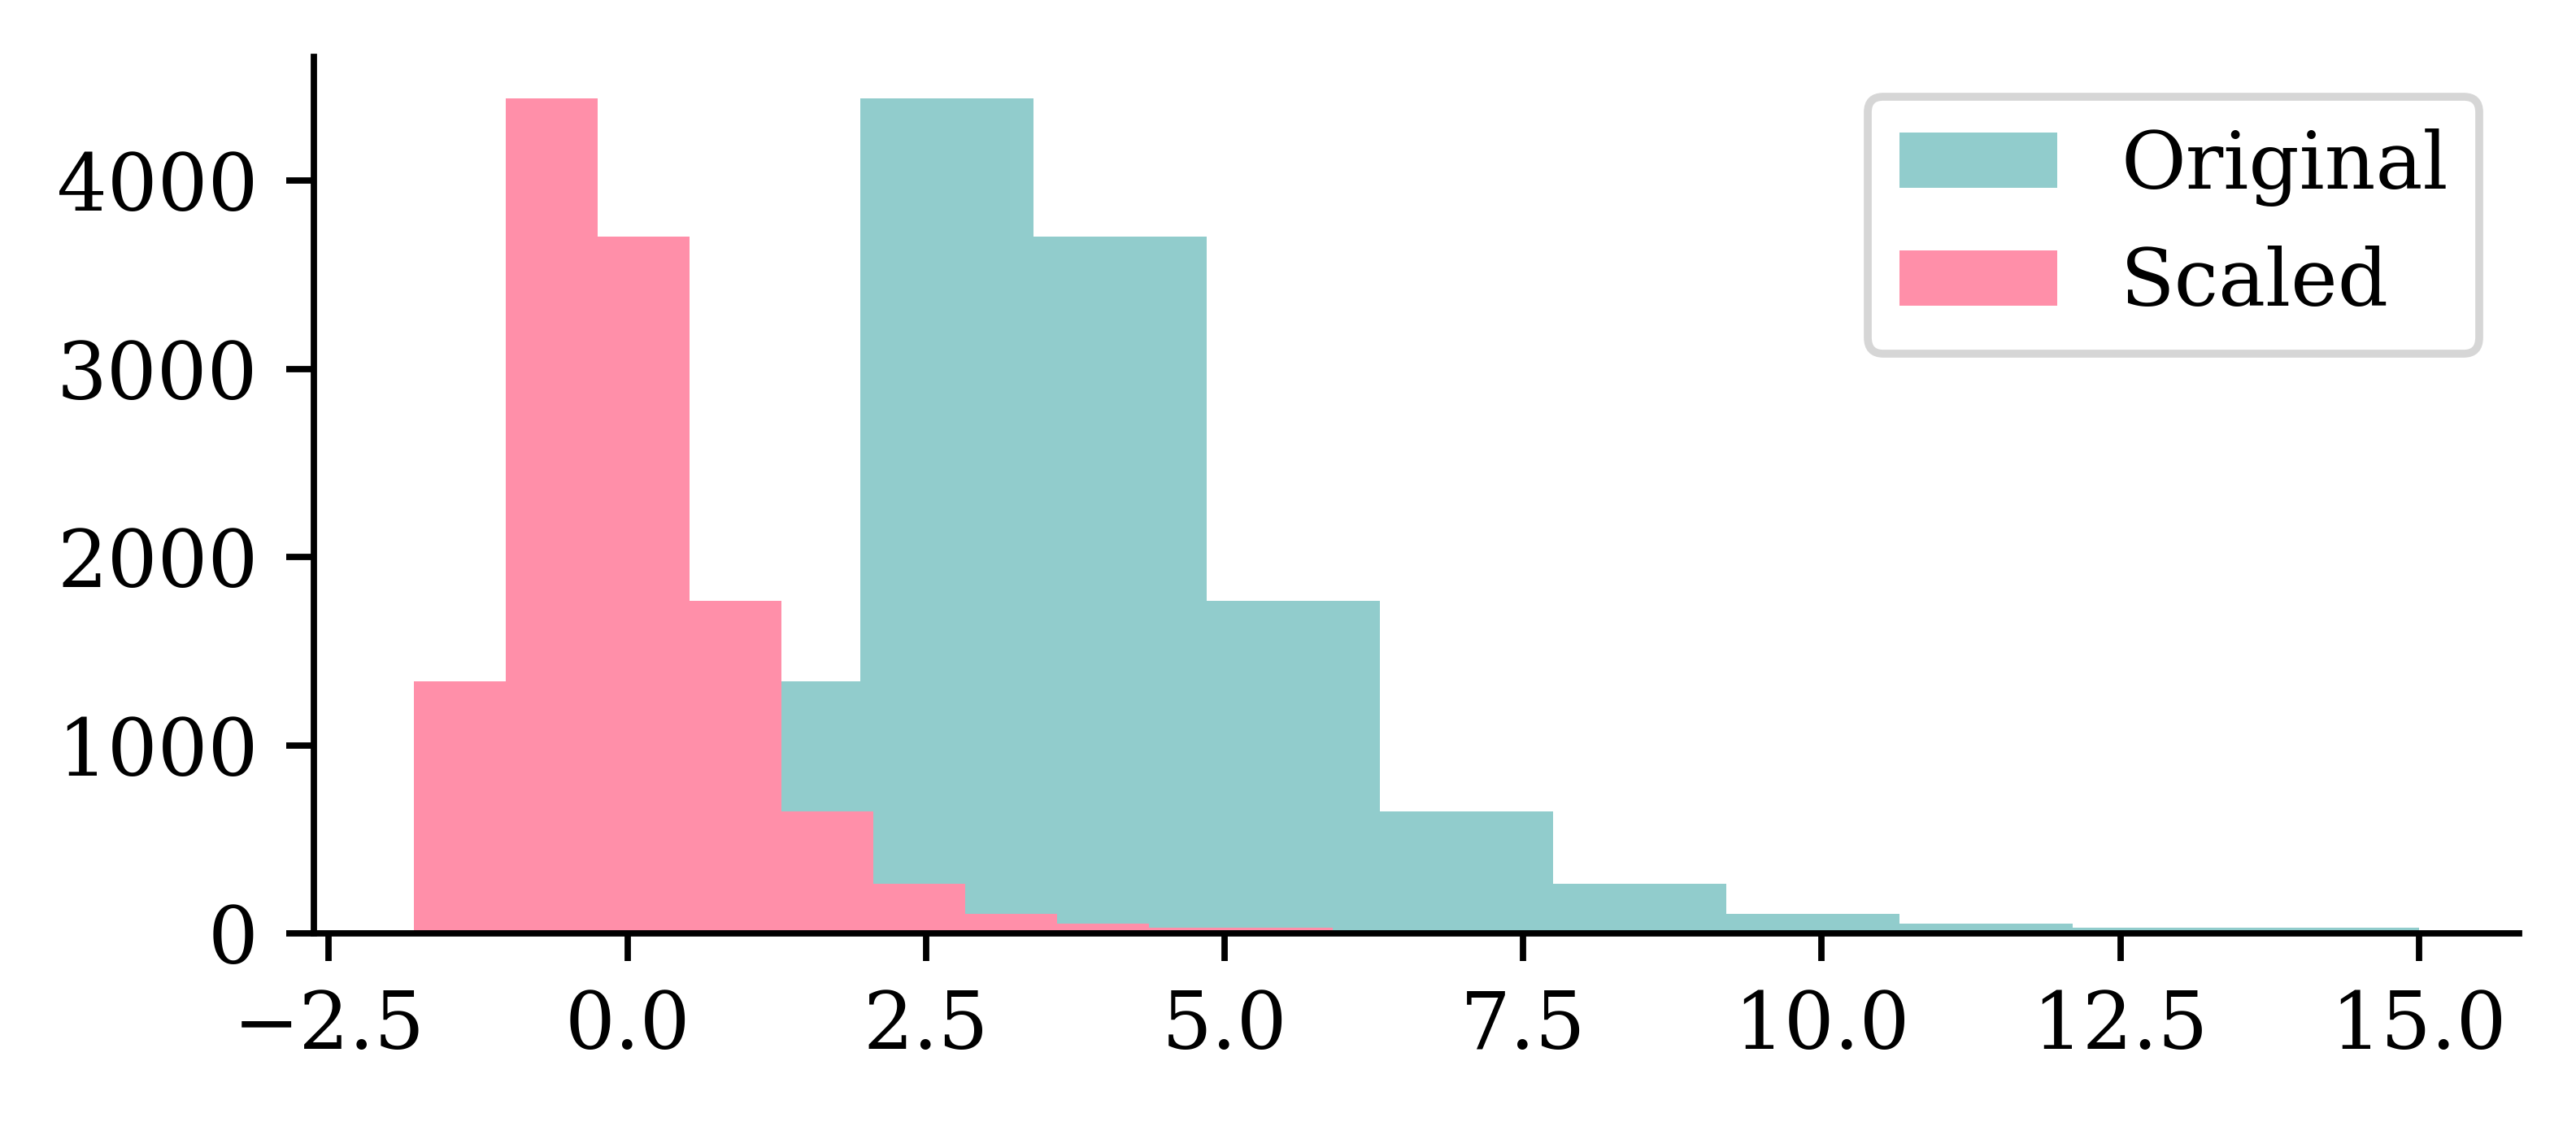
Re-scaling the inputs

scaler = StandardScaler()
scaler.fit(X_train)

X_train_sc = scaler.transform(X_train)
X_val_sc = scaler.transform(X_val)
X_test_sc = scaler.transform(X_test)
plt.hist(X_train.iloc[:, 0])
plt.hist(X_train_sc[:, 0])
plt.legend(["Original", "Scaled"]);

Same model with scaled inputs

random.seed(123)

model = Sequential([
    Dense(30, activation="leaky_relu"),
    Dense(1, activation="exponential")
])

model.compile("adam", "mse")

%time hist = model.fit( \
    X_train_sc, \
    y_train, \
    epochs=50, \
    verbose=False)
CPU times: user 33.1 s, sys: 768 ms, total: 33.8 s
Wall time: 33.3 s

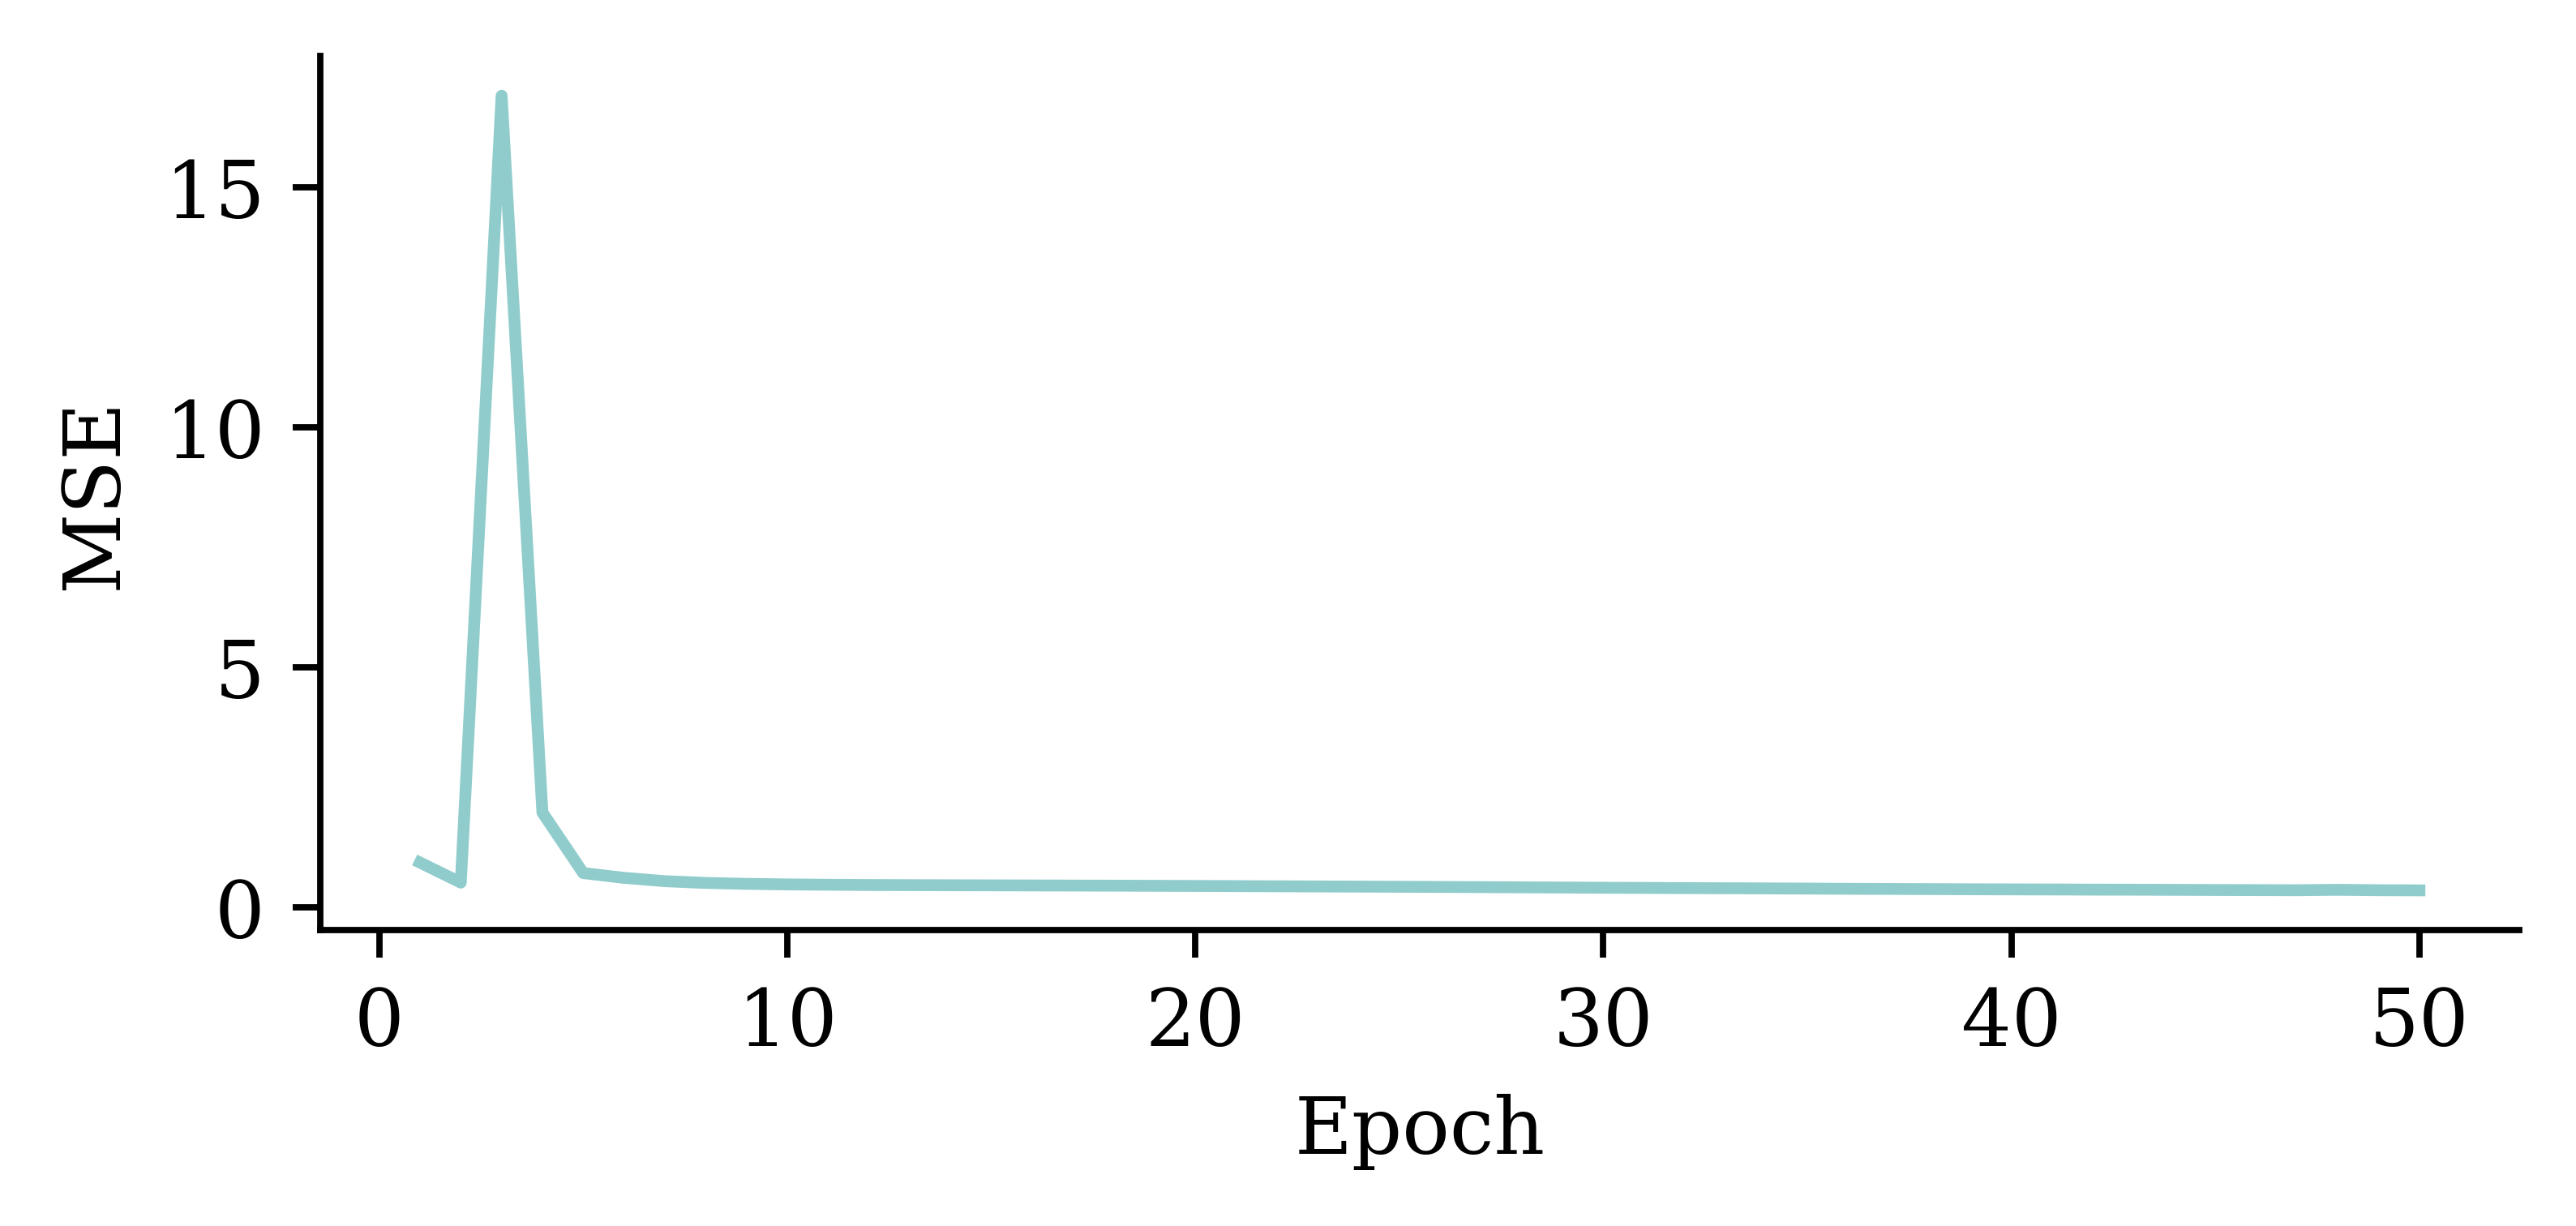
Loss curve

plt.plot(range(1, 51), hist.history["loss"])
plt.xlabel("Epoch")
plt.ylabel("MSE");

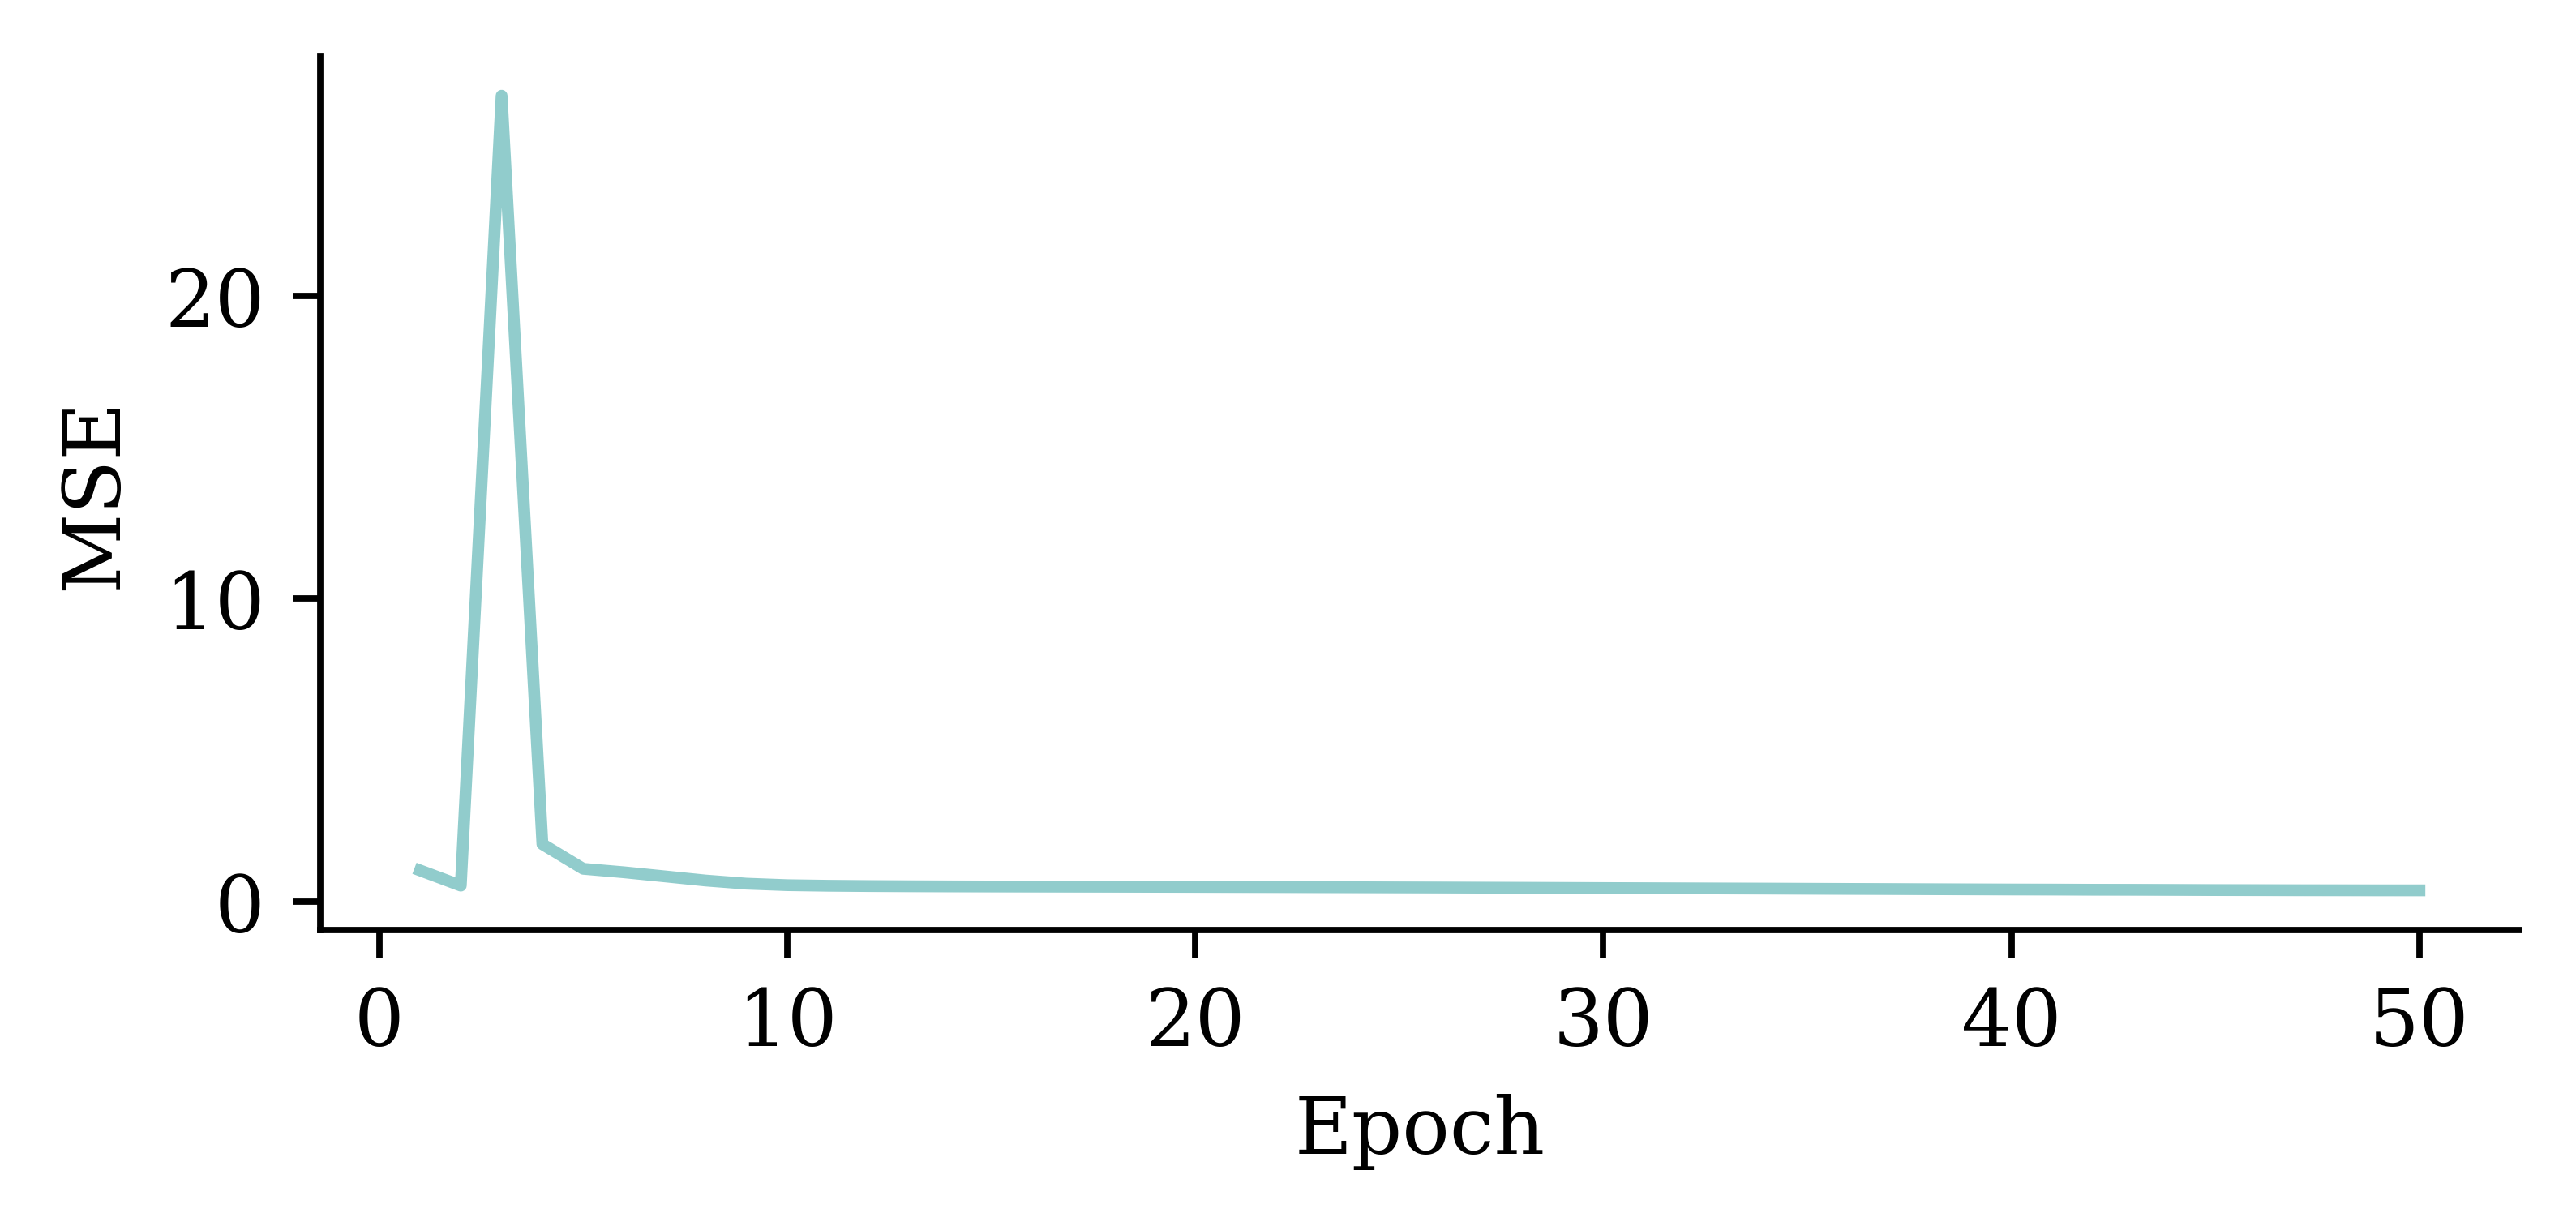
Loss curve

plt.plot(range(2, 51), hist.history["loss"][1:])
plt.xlabel("Epoch")
plt.ylabel("MSE");

Predictions

y_pred = model.predict(X_val_sc, verbose=0)
print(f"Min prediction: {y_pred.min():.2f}")
print(f"Max prediction: {y_pred.max():.2f}")
Min prediction: 0.00
Max prediction: 8.11
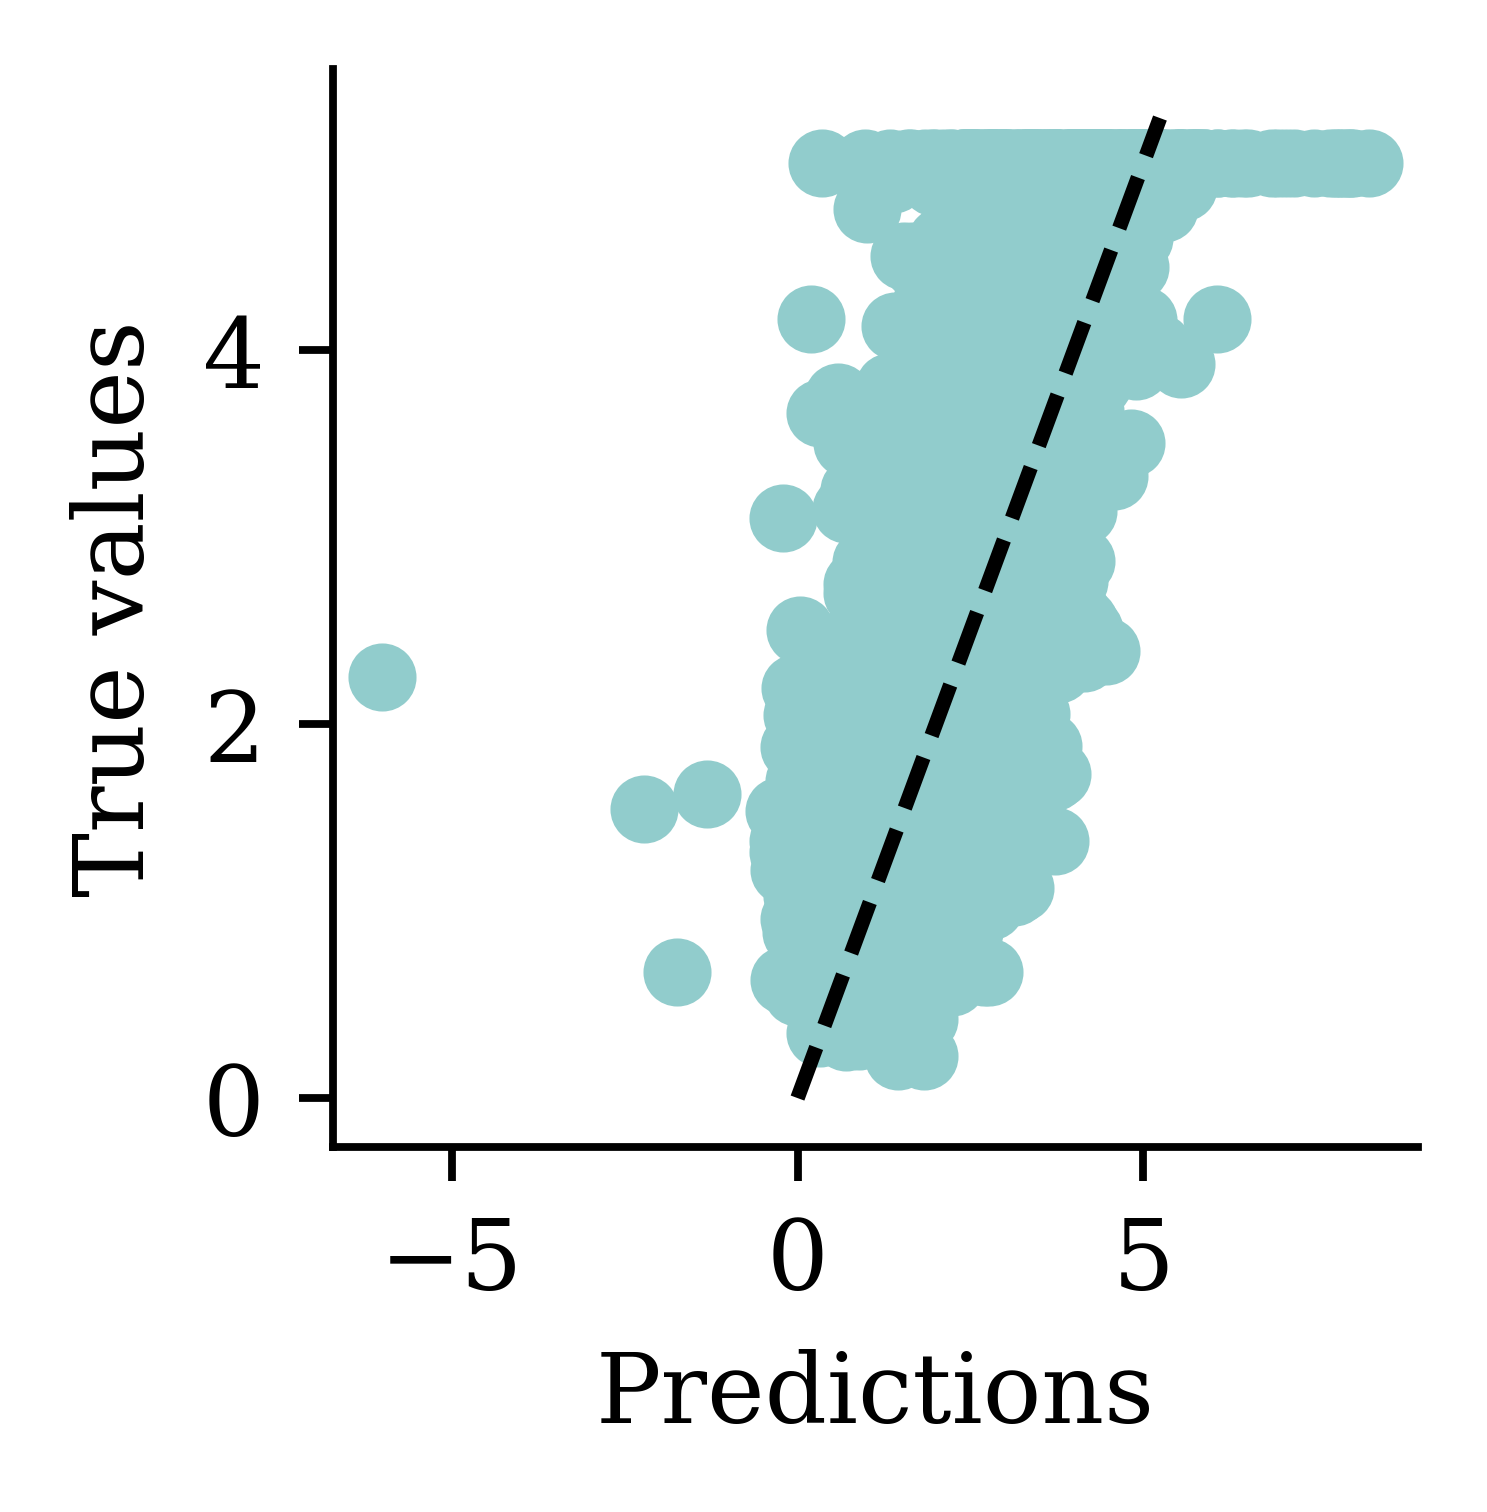
plt.scatter(y_pred, y_val)
plt.xlabel("Predictions")
plt.ylabel("True values")
add_diagonal_line()
mse_train["Exp ANN"] = mean_squared_error(
    y_train, model.predict(X_train_sc, verbose=0)
)
mse_val["Exp ANN"] = mean_squared_error(y_val, model.predict(X_val_sc, verbose=0))

Comparing MSE (smaller is better)

On training data:

mse_train
{'Linear Regression': 0.5291948207479792,
 'Basic ANN': 2.8278137790106026,
 'Long run ANN': 0.5999134938371403,
 'Exp ANN': 0.35574261079097375}

On validation data (expect worse, i.e. bigger):

mse_val
{'Linear Regression': 0.5059420205381369,
 'Basic ANN': 2.845539574957286,
 'Long run ANN': 0.6106608478598903,
 'Exp ANN': 0.347549802095409}

Comparing models (train)

train_results = pd.DataFrame(
    {"Model": mse_train.keys(), "MSE": mse_train.values()}
)
train_results.sort_values("MSE", ascending=False)
Model MSE
1 Basic ANN 2.827814
2 Long run ANN 0.599913
0 Linear Regression 0.529195
3 Exp ANN 0.355743

Comparing models (validation)

val_results = pd.DataFrame(
    {"Model": mse_val.keys(), "MSE": mse_val.values()}
)
val_results.sort_values("MSE", ascending=False)
Model MSE
1 Basic ANN 2.845540
2 Long run ANN 0.610661
0 Linear Regression 0.505942
3 Exp ANN 0.347550

Early Stopping

Lecture Outline

  • Artificial Intelligence

  • Deep Learning Successes (Images)

  • Deep Learning Successes (Text)

  • Classifying Machine Learning Tasks

  • Neural Networks

  • California House Price Prediction

  • Our First Neural Network

  • Force positive predictions

  • Preprocessing

  • Early Stopping

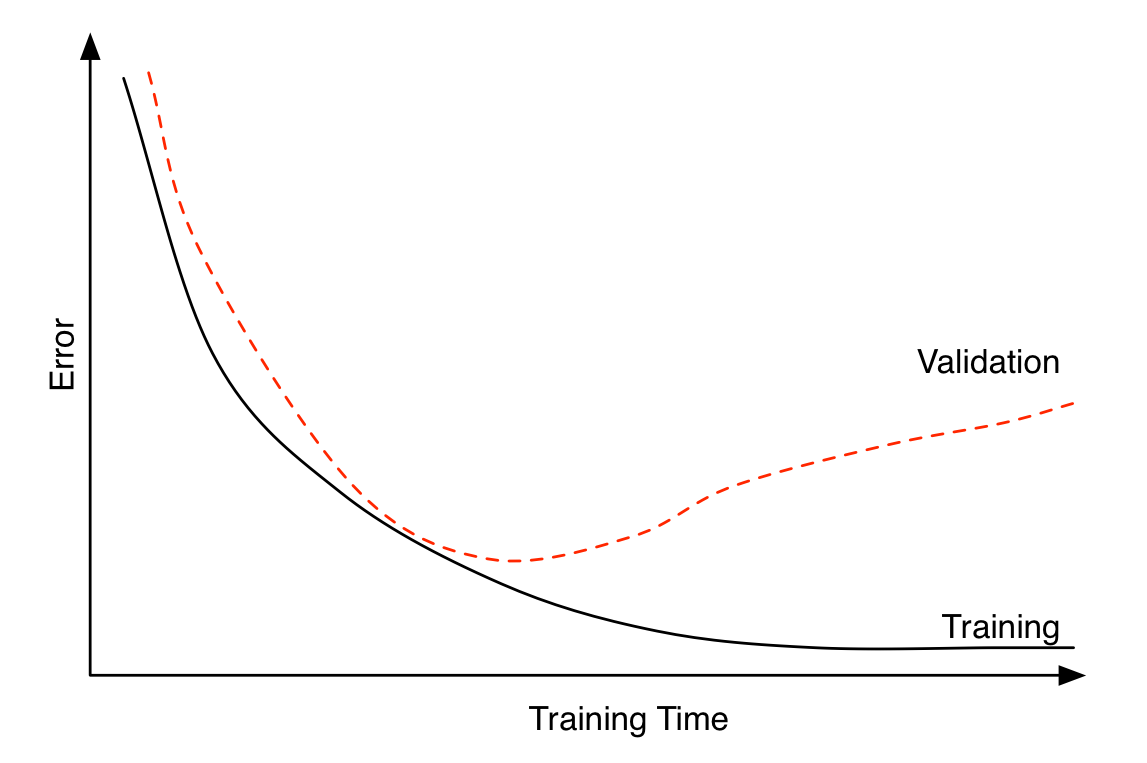
Choosing when to stop training

Illustrative loss curves over time.

Try early stopping

Hinton calls it a “beautiful free lunch”

random.seed(123)
model = Sequential([
    Dense(30, activation="leaky_relu"),
    Dense(1, activation="exponential")
])
model.compile("adam", "mse")

es = EarlyStopping(restore_best_weights=True, patience=15)

%time hist = model.fit(X_train_sc, y_train, epochs=1_000, \
    callbacks=[es], validation_data=(X_val_sc, y_val), verbose=False)
print(f"Keeping model at epoch #{len(hist.history['loss'])-15}.")
CPU times: user 22.7 s, sys: 631 ms, total: 23.4 s
Wall time: 22.9 s
Keeping model at epoch #12.

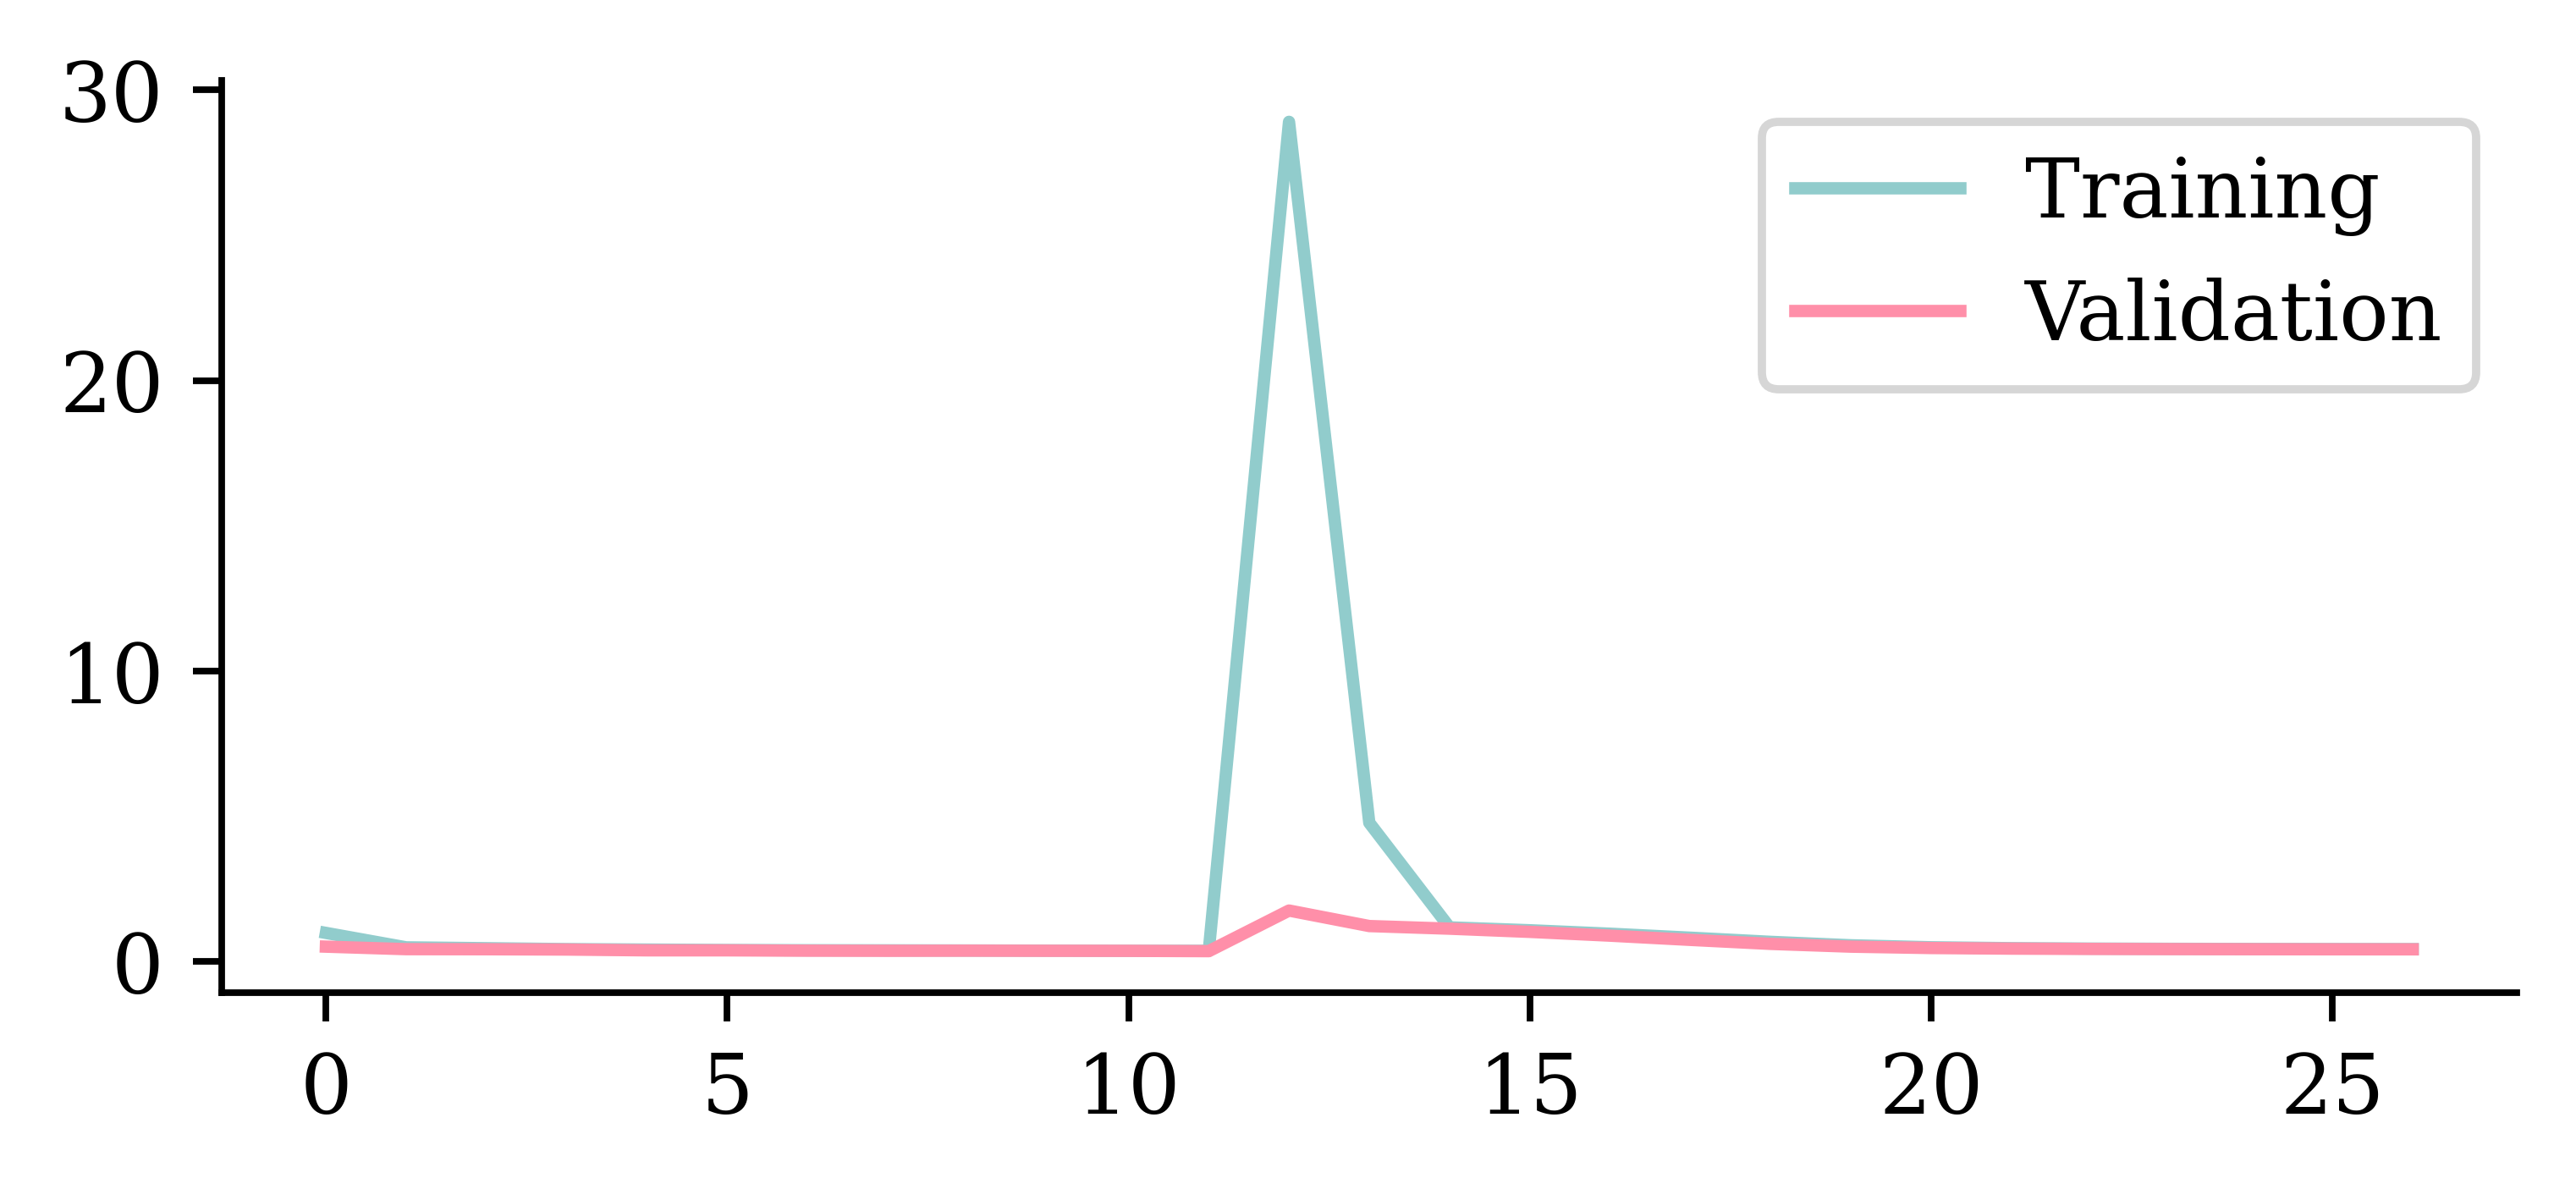
Loss curve

plt.plot(hist.history["loss"])
plt.plot(hist.history["val_loss"])
plt.legend(["Training", "Validation"]);

Loss curve II

plt.plot(hist.history["loss"])
plt.plot(hist.history["val_loss"])
plt.ylim([0, 8])
plt.legend(["Training", "Validation"]);

Predictions

Comparing models (validation)

Model MSE
1 Basic ANN 2.845540
2 Long run ANN 0.610661
0 Linear Regression 0.505942
4 Early stop ANN 0.359737
3 Exp ANN 0.347550

The test set

Evaluate only the final/selected model on the test set.

mean_squared_error(y_test, model.predict(X_test_sc, verbose=0))
0.36174060505869826
model.evaluate(X_test_sc, y_test, verbose=False)
0.3617406189441681

Another useful callback

random.seed(123)
model = Sequential(
    [Dense(30, activation="leaky_relu"), Dense(1, activation="exponential")]
)
model.compile("adam", "mse")
mc = ModelCheckpoint(
    "best-model.keras", monitor="val_loss", save_best_only=True
)
es = EarlyStopping(restore_best_weights=True, patience=5)
hist = model.fit(
    X_train_sc,
    y_train,
    epochs=100,
    validation_split=0.1,
    callbacks=[mc, es],
    verbose=False,
)
Path("best-model.keras").stat().st_size
24584

Keras model methods

  • compile: specify the loss function and optimiser
  • fit: learn the parameters of the model
  • predict: apply the model
  • evaluate: apply the model and calculate a metric


random.seed(12)
model = Sequential()
model.add(Dense(1, activation="relu"))
model.compile("adam", "poisson")
model.fit(X_train, y_train, verbose=0)
y_pred = model.predict(X_val, verbose=0)
print(model.evaluate(X_val, y_val, verbose=0))
4.442193984985352

Package Versions

from watermark import watermark
print(watermark(python=True, packages="keras,matplotlib,numpy,pandas,seaborn,scipy,torch"))
Python implementation: CPython
Python version       : 3.14.3
IPython version      : 9.13.0

keras     : 3.14.1
matplotlib: 3.10.9
numpy     : 2.4.4
pandas    : 3.0.2
seaborn   : 0.13.2
scipy     : 1.17.1
torch     : 2.11.0

Glossary

  • activations, activation function
  • artificial neural network
  • biases (in neurons)
  • callbacks
  • classification problem
  • cost/loss function
  • deep network, network depth
  • dense or fully-connected layer
  • early stopping
  • epoch
  • feed-forward neural network
  • Keras, TensorFlow, PyTorch
  • labelled/unlabelled data
  • machine learning
  • matplotlib
  • minimax algorithm
  • neural network architecture
  • perceptron
  • ReLU
  • representation learning
  • sigmoid activation function
  • targets
  • training/validation/test split
  • weights (in a neuron)

References

Shang, Z., Chauhan, V., Devi, K., & Patil, S. (2025). Artificial intelligence, the digital surgeon: Unravelling its emerging footprint in healthcare – the narrative review. Journal of Multidisciplinary Healthcare, 17, 4011–4022.